This site uses cookies to improve your experience. To help us insure we adhere to various privacy regulations, please select your country/region of residence. If you do not select a country, we will assume you are from the United States. Select your Cookie Settings or view our Privacy Policy and Terms of Use.
Cookie Settings
Cookies and similar technologies are used on this website for proper function of the website, for tracking performance analytics and for marketing purposes. We and some of our third-party providers may use cookie data for various purposes. Please review the cookie settings below and choose your preference.
Used for the proper function of the website
Used for monitoring website traffic and interactions
Cookie Settings
Cookies and similar technologies are used on this website for proper function of the website, for tracking performance analytics and for marketing purposes. We and some of our third-party providers may use cookie data for various purposes. Please review the cookie settings below and choose your preference.
Strictly Necessary: Used for the proper function of the website
Performance/Analytics: Used for monitoring website traffic and interactions
Google Analytics, where would I be without you?”. The website measurement and analytics tool serves as a dipstick into the effectiveness of your current marketing strategies, and into the effectiveness of your website as a whole. Once you’ve quenched your thirst for analytics with the easy stuff, what’s the next step?
In an attempt to provide a seamless member experience and aggregate all member data in one place, associations have been working with technology partners to perform system integrations through single sign-on, pushing all of their transaction data back into the AMS. Best of Both Worlds. Oh, and leave those old boxes at home.
The team at Association Analytics often hears questions like, What exactly is data analytics? What’s the difference between analytics and reporting? First: Reporting vs. Analytics. With analytics, you try to aggregate data over time and across data sources for a 360-degree view of your members and their activities.
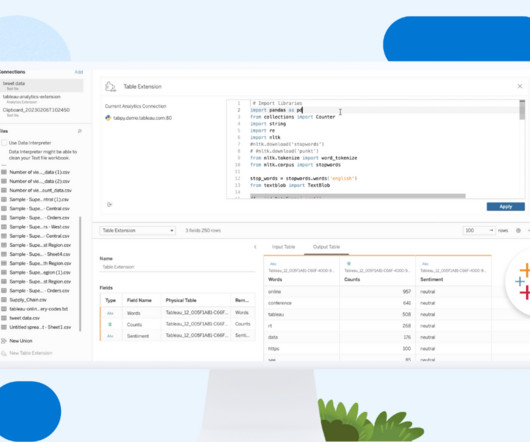
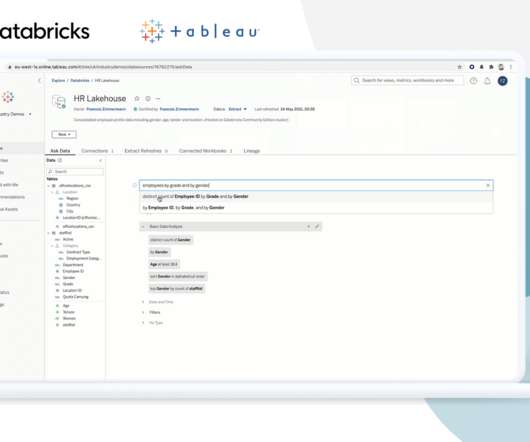
Swetha Bezawada Senior Data Scientist Colten Woo September 26, 2023 - 6:57pm October 2, 2023 The typical analytical ecosystem has two silos: business intelligence and data science. Analytics Extensions do just that! At the root, an Analytics Extension is a server that you stand up to receive data from Tableau in real-time.
Thrasio, the Amazon aggregator, raises $1B in fresh funding at a valuation of up to $10 billion. Dozens of other aggregators followed in Thrasio’s wake – some 150 according to Thrasio’s estimates, collectively raising some $15 billion in capital to fuel those ambitions – eyeing up the same opportunity as Thrasio was chasing.
Google Analytics helps nonprofits understand their website. It’s visual representations of data makes the task of aggregating and crunching data much easier and less time consuming. However, the power of Google Analytics can not be ignored. 20 custom Google Analytics dashboards from 5 Star Net.
One of those things is aggregating all the data from your other core systems (e.g. LMS, Events, Marketing Automation, Community) to provide analytical insights that can drive strategic priorities like member engagement, non-dues revenue and member retention. Association professionals know how important data analytics is now.
Product Marketing Manager, Embedded Analytics, Tableau. As a result, analytics dashboards and visualizations are beginning to appear everywhere: in consumer apps, business software, news sites, and more. Infusing analytics into user experiences is a way we can help our customers make smarter decisions and achieve greater success.
Product Marketing Manager, Embedded Analytics, Tableau. As a result, analytics dashboards and visualizations are beginning to appear everywhere: in consumer apps, business software, news sites, and more. Infusing analytics into user experiences is a way we can help our customers make smarter decisions and achieve greater success.
That includes sourcing for products (as well as wider supply chain challenges), analytics both to source the more interesting companies to buy up as well as to market those products once under the Thrasio wing, even its own fulfillment technology.
A recent Analytics in Action webinar, titled Embracing Data Analytics to Reinvent Your Content Marketing , delved into just this. During the webinar, Association Analytics VP of Strategy and Solutions Bill Conforti emphasized, “We’re talking more about like communications, right? So keep an eye on that.
Swetha Bezawada Senior Data Scientist Colten Woo September 26, 2023 - 6:57pm October 2, 2023 The typical analytical ecosystem has two silos: business intelligence and data science. Analytics Extensions do just that! At the root, an Analytics Extension is a server that you stand up to receive data from Tableau in real-time.
Sharon Liao Senior Product Manager, Tableau Bronwen Boyd March 30, 2023 - 5:29am April 4, 2023 As companies increasingly rely on data analytics to make informed decisions and gain a competitive edge, the challenge of presenting relevant and secure data to end users has become even more critical. What are user attribute functions?
Una Brands , an e-commerce aggregator focused on brands in the Asia-Pacific region, announced the first close of its Series B round at $30 million today. Its tech stack includes tools for brand management, marketing, supply chain and accounting, and process automation and advanced analytics.
But the foot traffic and location analytics startup saw growth in new categories, including consumer packaged goods (CPG) and hedge funds that use its tech to perform due diligence. Placer.ai, a location data analytics startup, raises $12 million Series A. Its last funding announcement was in January 2020 for a $12 million Series A.
Individual and aggregate data about clients will offer invaluable insights as to how well communities are being served and detail their persistent and unmet needs. Mental health is an acute need after a disaster like this.
At Opendoor, we’ve found that table documentation is challenging to automate, and the key to success has been a clear delineation of responsibility amongst our engineering and analytics teams for filling out these definitions in a well-defined place. When tables are not healthy, all downstream applications require a critical eye.
That’s according to Kfir Tishbi, who led the engineering team at Datorama, a marketing analytics company that was acquired by Salesforce in 2018. Avalor allows security teams to aggregate, normalize, de-duplicate and track risk data from discovery to remediation — at least the way Raz pitches it.
Apple announced today several new updates to its podcast creator tools, including, most notably, the addition of Subscription Analytics within Apple Podcasts Connect — the dashboard where podcasters track how their listeners engage with their shows.
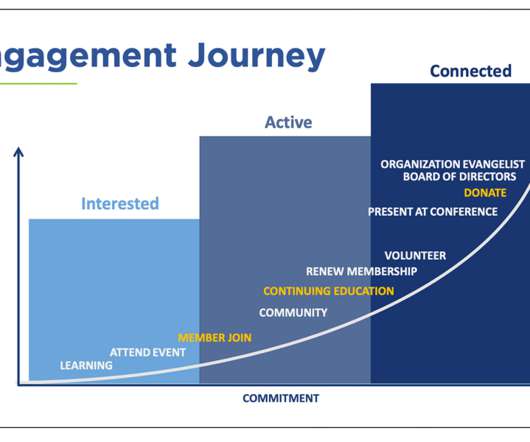
As you look at the data in aggregate, do so for both members and non-members to get a big picture of engagement behavior. Use aggregate scores to validate and improve member value. That’s why we built our data analytics platform, Acumen, specifically to help associations do just that. Start scoring member engagement today!
Open banking was supposed to democratize access to banking information, but the company believes banking aggregation APIs from Tink or Plaid are too expensive. Instead, Nordigen thinks it can provide a free API to access account information and paid services for analytics and insights services.
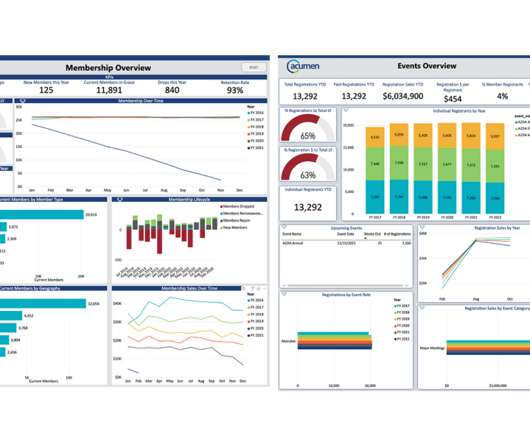
Another option is to leverage an analytics platform, like Acumen , to aggregate all your member and non-member data into one place that delivers out-of-the-box dashboards. The post Essential Steps for Tracking and Reporting Association KPIs appeared first on Association Analytics.
From Enormous Data back to Big Data Say you are tasked with building an analytics application that must process around 1 billion events (1,000,000,000) a day. Figure 9–1 : Events occur at precise moments of time and can be collected and processed individually (t1->t4), or can be aggregated across windows of time (w1).
In reflecting over the past three years, the definition of listening tools has broadened beyond “monitoring&# or “research&# to include several categories: social media engagement management, analytics, influencer identification, and social network analysis. The sources include Myspace, Facebook, Twitter, and LinkedIn.
Google Analytics helps nonprofits understand their website. It’s visual representations of data makes the task of aggregating and crunching data much easier and less time consuming. However, the power of Google Analytics can not be ignored. 20 custom Google Analytics dashboards from 5 Star Net.
Passive content gathering is when you are working throughout the week, aggregating links, content and information as you unintentionally stumble over it. By choosing a real person as the sender’s name, analytic suggest that the number of opens and click through rates have the potential to increase dramatically.
Just as you’ve finally settled into the shift from Universal Analytics (UA) to Google Analytics 4 (GA4) and started to get a handle on its new metrics, Google has yet another deadline for organizations to meet. On July 1, 2024, Google will permanently remove access to all Universal Analytics data.
Digital transformation allows organizations to aggregate information across systems. You can find information about companies that offer both analytics packages and training on.orgCommunity’s Solutions Center. Since day one, our goal has been and continues to be, building lasting relationships.
A newly released executive survey revealed that 99% of major American companies invested last year in data and analytics, and 91.9% The post Becoming a Data-Driven Association appeared first on Nucleus Analytics. of firms report that the pace of investment in these projects is accelerating.
Aggregate the data and look at it over time. S ee how NCARB was able to leverage their analytical insights by launching a new publication for their industry. The post Use Data for New Revenue Opportunities appeared first on Association Analytics. Start by tracking your members’ behaviors. age, geography, job type).
Whether it be a CRM , GoogleAnalytics , or a social media analytic tool like SproutSocial , measuring and understanding data is an essential part of contemporary business. This is true despite that fact the majority of fundraising, data aggregation, and data storage is done using highly sophisticated software and technologies.
Editorial calendars organize posting times, dates, topic, location, and analytics. When all of this information is aggregated, it can be an extremely powerful tool for analyzing engagement, popular topics, and keep track of what your nonprofit has published online.
To measure the return on investment – or ROI – of your SEO campaigns, utilize the information aggregated from Positionly and Google Analytics to pull through the data and analyze patterns in traffic, increases in links, sustainable traffic and above all, increases in revenue. Rising non-branded organic traffic.
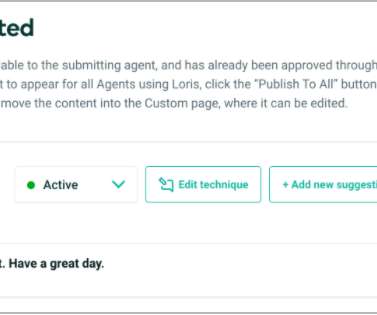
“We draw our insights from anonymized, aggregated data that have been scrubbed of personally identifiable information,” Hertz emphasized when asked about Loris’ privacy and data retention policies. ” Loris, which has 15 employees, aims to triple its workforce this year.
This dual-audience analytics approach provides a complete picture of your digital presence and impact. Evolve Your Analytics Approach Pay attention to both traditional web analytics and how AI systems interact with your content. Monitor and Adapt Regularly analyze bot interactions to refine your strategy continuously.
Users can currently connect to Stripe, QuickBooks Online, WooCommerce, Google Analytics and Admob for apps, which means they can expose their online business performance with one-click, and buyers can seamlessly assess financial and operational performance.”. Our strategy is verification at the source, i.e. data,” Hutchison said.
Use aggregate engagement scores to: Validate your value proposition. Define personas – aggregate data and build a journey map by persona. The post Get the Most Out of Engagement Scoring appeared first on Association Analytics. Here are a few ideas: Use individual engagement scores to find: Buyers. Award nominees.
In 2021, the e-commerce roll-up, or aggregator, scene was in full force. Wonder Brands picks up $20M, aims to build marketplace of Latin American e-commerce brands E-commerce aggregators today That gobbling up of e-commerce brands has slowed down , and there’s even been some consolidation within the aggregator sector.
" 5 Web Reports Every Nonprofit Should Know – Google Analytics | NetWitsThinkTank.com – "Those who follow me on Twitter, or for whom I’ve helped implement NetCommunity websites, won’t be surprised to find me write about Google Analytics.
Posted by Badih Ghazi, Staff Research Scientist, and Nachiappan Valliappan, Staff Software Engineer, Google Research Recently, differential privacy (DP) has emerged as a mathematically robust notion of user privacy for data aggregation and machine learning (ML), with practical deployments including the 2022 US Census and in industry.
Aggregated results are then pulled into a data warehouse , or semantic layer, where business users can interact with the data using business intelligence tools. . Concurrency: Our customers are starting to use Databricks SQL Analytics endpoints to run SQL- and BI-optimized compute clusters within a Databricks lakehouse.
Once the team aggregated the data and they were able to form a hypothesis, test it and confirm a need. The post Three Data-Informed Strategies for Better Member Engagement appeared first on Association Analytics. Want to learn more about how we help associations successfully leverage data to grow and engage with their membership?
Traditional banks have an extremely limited ability to view the aggregate financial position of an SME that holds capital across multiple institutions and in multiple instruments, which makes securing finance very difficult. Open banking will also allow peer comparison analytics far ahead of what we have seen until now.
As a way to identify ‘experts’ in certain areas of code, and provide aggregated context around who was responsible for what parts of the source code? “This has led us to where we are today, where our mission is to support operational analytics for software engineering teams,” DeVivo said.
We organize all of the trending information in your field so you don't have to. Join 12,000+ users and stay up to date on the latest articles your peers are reading.
You know about us, now we want to get to know you!
Let's personalize your content
Let's get even more personalized
We recognize your account from another site in our network, please click 'Send Email' below to continue with verifying your account and setting a password.


Let's personalize your content