13 Critical Nonprofit Stats From 2023
NonProfit PRO
DECEMBER 18, 2023
Here's a recap of the lessons we've learned this year through stats. At NonProfit PRO, we strive to keep the pulse of the nonprofit sector.
This site uses cookies to improve your experience. To help us insure we adhere to various privacy regulations, please select your country/region of residence. If you do not select a country, we will assume you are from the United States. Select your Cookie Settings or view our Privacy Policy and Terms of Use.
Cookies and similar technologies are used on this website for proper function of the website, for tracking performance analytics and for marketing purposes. We and some of our third-party providers may use cookie data for various purposes. Please review the cookie settings below and choose your preference.
Used for the proper function of the website
Used for monitoring website traffic and interactions
Cookies and similar technologies are used on this website for proper function of the website, for tracking performance analytics and for marketing purposes. We and some of our third-party providers may use cookie data for various purposes. Please review the cookie settings below and choose your preference.
 Stats Related Topics
NonProfit PRO
AUGUST 5, 2022
Here are 11 nonprofit sector stats. Because of the importance of the nonprofit sector in this changing society, updated nonprofit facts and statistics are important to know and understand.
This site is protected by reCAPTCHA and the Google Privacy Policy and Terms of Service apply.
Nonprofit Tech for Good
SEPTEMBER 13, 2021
See Also: [DATA] 11 Must-Know Stats About Nonprofit Websites. DATA] 11 Must-Know Stats About How Nonprofits Use Email. Of those: 70% send automatic donation receipts via email. 32% send automatic year-end tax receipts via email. 32% send an automatic “Welcome” series to new online donors via email. Why the Open Data Project?
NonProfit PRO
APRIL 18, 2023
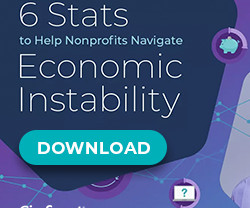
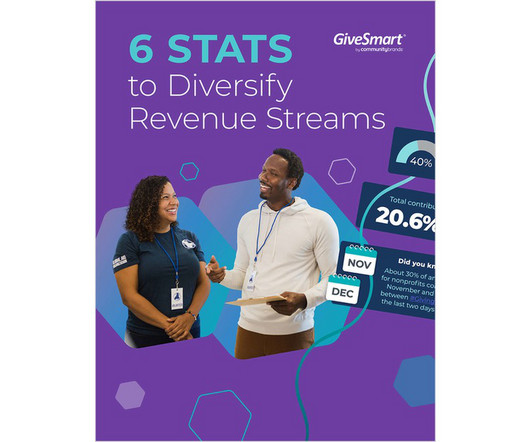
This infographic has the stats and tips your organization needs for expanding your reach, from revenue streams to your fundraising platforms, and beyond. According to a recent Community Brands survey, most nonprofits are confident that the economy will stabilize in 2023, there are things you can do to find stability amidst the uncertainty.
Nonprofit Tech for Good
MARCH 31, 2021
The 2021 Open Data Project [ español , français ] seeks to gain a better understanding of how nonprofits, NGOs, and charities worldwide use technology for digital marketing and fundraising. At the core of the project is the 2021 Global NGO Technology Survey.
Nonprofit Tech for Good
JUNE 6, 2020
The 2020 Global Trends in Giving Survey closed June 1 and the full results will be released September 14 in the third edition of the Global Trends in Giving Report. 7,008 survey respondents from 81 countries indicated in the survey that they had donated in response to the COVID-19 pandemic and some characteristics of these donors are listed below.

NonProfit PRO
DECEMBER 17, 2024
Heres a statistical summary of our 2024 coverage to help you and your nonprofit grow your impact and revenue in 2025.
Nonprofit Tech for Good
DECEMBER 7, 2024
The presentation will help you: Identify the key elements of a repeatable and compelling pitch or case for support Find 1-3 powerful stories, results, or goals that light a fire in others Understand what to do instead of listing stats and programs Register Now! Please Note: This webinar will be recorded.
Nonprofit Tech for Good
FEBRUARY 1, 2022
The Open Data Project [ español , français ] seeks to gain a better understanding of how nonprofits, NGOs, and charities worldwide use technology for digital marketing and fundraising.
Nonprofit Tech for Good
JUNE 1, 2021
The 2021 Open Data Project [ español , français ] seeks to gain a better understanding of how nonprofits, NGOs, and charities worldwide use technology for digital marketing and fundraising.

NonProfit PRO
MARCH 22, 2023
Kevin Scally, chief relationship officer at Charity Navigator shared that with a shrinking donor population, recurring gifts can both democratize philanthropy and lower the barriers for giving.

NonProfit PRO
FEBRUARY 21, 2025
Here's a look at one of the many metrics you can and should regularly review to evaluate your fundraising efforts.

VentureBeat
FEBRUARY 11, 2025
ANALYSIS: Stats might be everything in basketball but for Pacers Sports and Entertainment (PS&E), data about fans is just as valuable.

NonProfit PRO
DECEMBER 1, 2023
PHLYTRAC gives dynamic insights into driver behavior, vehicle stats, and more to help organizations lower the risk of driver-related accidents. Using GPS technology, organizations are in the driver's seat with access to live maps, driver scorecards, a fleet management dashboard with vehicle health, and much more!

NonProfit PRO
SEPTEMBER 7, 2023
PHLYTRAC gives dynamic insights into driver behavior, vehicle stats, and more to help organizations lower the risk of driver-related accidents. Using GPS technology, organizations are in the driver's seat with access to live maps, driver scorecards, a fleet management dashboard with vehicle health, and much more!

NonProfit PRO
OCTOBER 5, 2023
PHLYTRAC gives dynamic insights into driver behavior, vehicle stats, and more to help organizations lower the risk of driver-related accidents. Using GPS technology, organizations are in the driver's seat with access to live maps, driver scorecards, a fleet management dashboard with vehicle health, and much more!

NonProfit PRO
NOVEMBER 2, 2023
PHLYTRAC gives dynamic insights into driver behavior, vehicle stats, and more to help organizations lower the risk of driver-related accidents. Using GPS technology, organizations are in the driver's seat with access to live maps, driver scorecards, a fleet management dashboard with vehicle health, and much more!

Nonprofit Tech for Good
SEPTEMBER 14, 2020
10 Key Stats from the. If you would like to share the report with your communities, you can download a set of promo graphics from DropBox , download infographics from the website , and copy-and-paste a summary of the report. 2020 Global Trends in Giving Report. 55% of donors worldwide prefer to give online with a credit or debit card.
Nonprofit Tech for Good
DECEMBER 28, 2021
Here’s a step-by-step guide on how to accomplish this: First, gather your GivingTuesday and end-of-year stats and personal stories in one place. Start by gathering up all the stats you can on your GivingTuesday and end-of-year giving.

Wired
MARCH 19, 2025
Safety researchers claim Elon Musks auto company has a long history of potentially misleading stats. Now it looks like his government department is following suit.

Mashable Tech
MARCH 25, 2025
Today's connections fall into the following categories: Yellow: Move on from a player Green: Baseball stats, abbreviated Blue: Famous Bos Purple: First four letters of NBA team names Looking for Wordle today? Here's the answer to today's Wordle. Ready for the answers? The solution to today's Connections Sports Edition #183 is.

Wired
APRIL 16, 2025
The killer stat: It only costs $17,000. Meet the Sakura, the best-selling electric car in Japan. It has driver assistance, auto-parking, fast charging, bi-directional power, and acres of charm.

Mashable Tech
MARCH 24, 2025
The tension dial on this rowing machine allows you to choose between 16 levels of resistance while the display gives you quick workout stats like distance rowed, time, calories burned, and speed. While most rowing machines cost hundreds, today's deal at Amazon brings the Merach Q1S down to about $180.

Bloomerang
NOVEMBER 25, 2024
Here’s a stat to ease your mind, dear fundraiser: the average nonprofit sends around eight emails in December alone. By the time you’re on your 3rd, 5th, or 11th email appeal, you start wondering, “Is everyone on my list ready to throw rocks at me?” ” They don’t. If they did, they’d unsubscribe, and that’s okay, too!

TechSpot
DECEMBER 31, 2024
The ever-helpful SteamDB stat tracker reveals that as we enter the final few hours of 2024, a massive 18,965 games (at the time of writing) have been released on Steam during these last 12 months. Read Entire Article

Mashable Tech
MARCH 31, 2025
Instead of a watch counting your steps or tracking your sleep, the Galaxy Ring takes care of those stats. If you're not interested in a smart watch , the Samsung Galaxy Ring is a really great alternative. With a lightweight design and a sleek style, the Galaxy Ring won't need to come off for sleeping or that fancy event.
Nonprofit Tech for Good
NOVEMBER 1, 2020
You’ll also want to keep track of these stats. First, engagement indicates the the success of the content you are posting, allowing you to build a strong community. You can also use the data to measure your progress against your goals. This can come in very useful for tracking your progress and engagement.

Mashable Tech
APRIL 8, 2025
These include heart rate tracking, sleep tracking, and an Energy Score that shows how ready you are to take on the day based on stats from the previous day. It also offers Wellness Tips that can help keep you on track towards your goals.

Mashable Tech
APRIL 11, 2025
It boasts a wide variety of health and fitness features to help you stay on top of your goals as well, including an Energy Score that shows you how ready you are to take on the day based on stats related to the previous day's sleep patterns, heart rate, and steps.
Nonprofit Tech for Good
APRIL 10, 2022
Using a graphic design tool such as Canva or Venngage , converting powerful stats, quotes, and CTAs into graphics is a time-tested, proven method to grab the attention of your followers, thus increasing your engagement on Twitter (and all social media). Create custom graphics for powerful quotes, statistics, and call-to-actions.

Blue Avocado
DECEMBER 10, 2024
Harriett Davis from the Chicago Public Library Foundation Tell the Story of Your Mission Not Just What Your Mission is I have found that, as grant applications have gone online and gotten shorter, my strategy has become ever more important: Concise, clean, and emotive storytelling works better than stats and history.

TechSpot
MARCH 4, 2025
Daniel Parris from Stat Significant recently set out to answer this age-old question. To quantify it, Parris looked at IMDb user ratings (ranging from 1 to 10) for Friends and found the average to be around 8.34. Using this figure as the benchmark, Parris noticed that it wasn't until episode. Read Entire Article

CauseVox
JANUARY 20, 2025
From these stats, you would have retained 40% of your donors, and lost 60%. Segment out the returning donors in 2024 Divide the number of returning donors by the total number of donors the previous year. For example, say you had 100 donors from last year that returned to give gifts again out of the total 250 donors.

Mashable Tech
MARCH 3, 2025
Here are the stats that matter: Price: $1,139.96 (Was $1,296.99) Retailer: Amazon Display: 86-inch QNED, 4K UHD Processor: a5 AI Processor Gen 7 HDR: HDR10 Pro Refresh Rate: 60Hz Smart Features: webOS with 5-year Re:New updates, Alexa built-in Audio: Virtual 5.1

Pamela Grow
OCTOBER 24, 2024
In September 2024, the results were: 396 donors for a total of $79,553 (this included a $25,000 donation for a match) Our 3rd Quarter stats were: 2023 – 459 gifts for a total of $ 97,710 2024 – 764 gifts for a total of $121,657 Thanks to you, I have a calendar that maps out my fundraising deadlines and detailed plan of action.
Nonprofit Tech for Good
APRIL 5, 2021
That said, the Community Foodbank of Southern Arizona shows that photos taken in real-time that communicate the story of their mission and programs can be engaging and that not all visual content on Instagram need be of exotic travel locations, impromptu modeling shots, or of stunning nature scenery to be effective: Also, inspirational quotes and powerful (..)

NonProfit PRO
APRIL 10, 2023
What Americans Think About Philanthropy and Nonprofits,” a new study from the Indiana University Lilly Family School of Philanthropy, polled about 1,300 Americans over the summer of 2022 to learn more about how the American public perceives philanthropy and the nonprofit sector.

NonProfit PRO
DECEMBER 7, 2022
OneCause released its new report: The 2023 Fundraising Outlook: Insights for Nonprofit Planning & Prioritization.

NonProfit PRO
JULY 8, 2021
We’re going to review the Facebook Fundraising Benchmarks Report 2020 by GivePanel. Let’s clarify what “Facebook fundraising” refers to. It’s probably exactly what you think it is: when someone on Facebook starts a fundraiser to support your nonprofit. But there’s some fine print here.
NonProfit PRO
JANUARY 17, 2023
From the state of individual giving, donor retention and the struggle to win over one-time donors, here are the biggest takeaways from the recent “Quarterly Fundraising Report" by the Fundraising Effectiveness Project.

NonProfit PRO
AUGUST 16, 2021
Every nonprofit wants to attract younger donors. That’s why it’s very exciting that monthly giving is so appealing to these younger donors. Because they can support those organizations, they care about in a very easy way with a small amount that absolutely fits their budget.

NonProfit PRO
DECEMBER 20, 2022
According to survey data from FreeWill, millennials and Gen Xers whose parents or grandparents work with a financial adviser and who expect to receive an inheritance, are likely to seek professional help in managing their money once they have more of it.
Expert insights. Personalized for you.
We have resent the email to
Are you sure you want to cancel your subscriptions?


Let's personalize your content