This site uses cookies to improve your experience. To help us insure we adhere to various privacy regulations, please select your country/region of residence. If you do not select a country, we will assume you are from the United States. Select your Cookie Settings or view our Privacy Policy and Terms of Use.
Cookie Settings
Cookies and similar technologies are used on this website for proper function of the website, for tracking performance analytics and for marketing purposes. We and some of our third-party providers may use cookie data for various purposes. Please review the cookie settings below and choose your preference.
Used for the proper function of the website
Used for monitoring website traffic and interactions
Cookie Settings
Cookies and similar technologies are used on this website for proper function of the website, for tracking performance analytics and for marketing purposes. We and some of our third-party providers may use cookie data for various purposes. Please review the cookie settings below and choose your preference.
Strictly Necessary: Used for the proper function of the website
Performance/Analytics: Used for monitoring website traffic and interactions
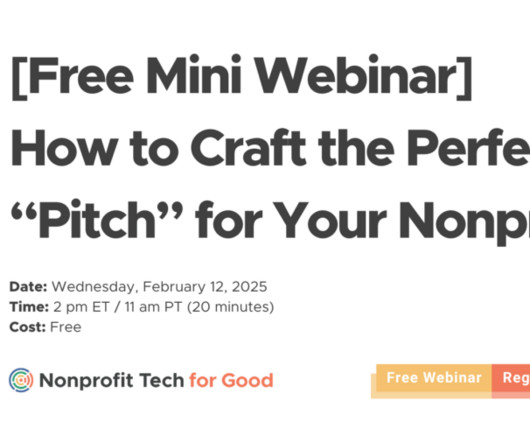
The presentation will help you: Identify the key elements of a repeatable and compelling pitch or case for support Find 1-3 powerful stories, results, or goals that light a fire in others Understand what to do instead of listing stats and programs Register Now! Please Note: This webinar will be recorded.
The 2020 Global Trends in Giving Survey closed June 1 and the full results will be released September 14 in the third edition of the Global Trends in Giving Report. It’s worth noting that 68% of the COVID-19 donors were female, 31% male. 41% were Baby Boomers, 24% Millennials, 22% Gen X, 11% Matures, and 2% Gen Z.
While there’s a ton of insightful data I could share, there are 5 must-know recurring giving stats I want you to know. If you want to dig into all of the results, you can check out the full study (including 32 unique and data-driven test ideas) at: recurringgiving.com. The result? This is a really scary stat to me.
That said, below are 12 stats to consider and research further about online fundraising, social media, and mobile technology. 21% of peer-to-peer fundraising dollars raised are the result of a direct click-through on social media. Online donations accounted for 7.2% of all revenue raised in 2016. Source: 2016 Charitable Giving Report.
Fundraising Stats. A pop-up asking a one-time donor to upgrade to become a monthly donor results in a 64% increase in monthly donations ( NextAfter ). Social Media Stats. Have a stat to add? The average online gift in 2018 was $96.40 USD ( Blackbaud Luminate Online Report ). 11% via direct mail/post. 9% via PayPal.
As the largest, and still growing, generation, tapping into this group of individuals can offer a chance to foster relationships that have the potential to result in long-term support for your cause. Check out our full report of stats about connecting with Gen Z supporters.
English, français, português y español, the 2018 Global NGO Technology Report is based on the survey results of 5,352 NGOs from 164 countries. Newly Released! The 2018 Global NGO Technology Report. Published in ????????????,
Until recently the nonprofit pioneers of the Social Web had to mostly rely on their intuition that their social media campaigns were resulting in more dollars raised online, an increase in brand and cause awareness, and higher rates of volunteer recruitment and retention. Using Twitter during fundraising events can result in 10X more.
FEG announced the release of results from the eighth annual FEG 2022 Community Foundation Survey, a survey of nearly 100 U.S. community foundations representing approximately $38 billion in assets under advisement.
Since social media is changing so often, it can be hard to keep up with stats and trends that affect how you use it. I quite often forget the facts that I’ve read, or I use Twitter based on stats that are outdated now. This is another stat that was similar for Facebook. This post was originally published on the Buffer blog.
The TwtPoll results are often surprising and can be very useful for nonprofits as they forge ahead with their 2010 communications strategies. 7) Is your nonprofit monitoring your Website stats to see how much traffic is coming from Facebook, Twitter, MySpace, LinkedIn Groups, etc.? [ [link] ]. 28% 2,501-5,000. 22% 501-2,500.
Here is our breakdown of relevant stats and facts by year for Giving Tuesday, along with general giving trends and Giving Tuesday’s place in the larger Thanksgiving shopping headspace. Giving Tuesday 2020 stats. Giving Tuesday 2019 stats. Giving Tuesday 2018 stats. Giving Tuesday 2017 stats. Enroll Now.
If your NGO is hoping to increase awareness of your cause and fundraising results on a global scale, then you must schedule Facebook Updates and tweets in advance. Facebook Scheduling Function: HootSuite for Scheduling Tweets: 3) Tap into the power of stats and inspirational quotes. Photo: Jeremy Barnicle/Mercy Corps.
Many nonprofits make a serious error in thinking that the annual reporting of how the sector’s doing is predictive of the future. In reality, external factors such as changes in the economy, donor expectations, and leadership, have a much more significant impact on a nonprofit's future performance.
I t's the season for a slew of reports analyzing last year's online giving results. Convio released their 2010 Online Nonprofit Benchmark Study in March, based on results from nearly 500 clients. Its findings included: 14% growth in online giving overall.
Thus, in time for the year-end fundraising season, below are 20 stats about fundraising and social media that every nonprofit needs to know. Email results in one-third of online fundraising revenue. Nearly 1/3 of all online donations are now a result of peer-to-peer fundraising. Source: mGive. Source: Salsa Labs. Source: M+R.
Pablo by Buffer enables social media managers to easily create inspirational quote and powerful stat images perfectly sized for social media. Stats & Research. Internet Live Stats :: internetlivestats.com. Internet World Stats :: internetworldstats.com. Pablo :: buffer.com/pablo. Piktochart :: piktochart.com.
Like all Networked Nonprofits, Momsrising values simplicity and the ability to leverage its network while engaging and building relationships with people and organizations to get results. Instead, they identify key organizational results areas and associated metrics to define successes and failures. getting policies passed.
In advance of the event, your new media manager should prepare a minimum of 10 tweets and two or three posts for Facebook, Google+, Tumblr, and so on (depending on how many days your event is scheduled for) to maximize marketing and fundraising results. Listen carefully and be selective. Write in the third person.
With usage stats like that it’s probably safe to assume that a large portion of your supporter are using at least one social network, right? The results we’re pretty amazing (though arguably not in any way shocking). This resulted in increased fundraising results by up to 40%. Twitter has over 16 million users.
Simply enter your nonprofit’s name and Addictomatic then creates a page of all your search results for easy future reference. Google Internet Stats :: google.co.uk/intl/en/landing/internetstats. A collection of economic and media trends and stats. Alexa Top Sites :: alexa.com/topsites. intl/en/landing/internetstats.
The rise of Twitter has resulted in a new campaign awareness strategy and online event known as a tweet chat. Prewrite at least 10 tweets that you can post during lulls in order to increase engagemen, such as powerful stats, inspirational quotes, and thought-provoking questions.
And when I poll my webinar attendees about where they first heard about the webinar… the results are always the same: 1) Referral from friend 2) My Blog 3) My e-mail newsletter 4) Twitter 5) Other 6) Facebook. I get little to no website or blog traffic from Facebook (most comes from Twitter and LinkedIn).
Here’s a step-by-step guide on how to accomplish this: First, gather your GivingTuesday and end-of-year stats and personal stories in one place. Start by gathering up all the stats you can on your GivingTuesday and end-of-year giving. RoundUp App is a fun and approachable solution to monthly giving for both nonprofits and donors.
Based on data gleaned from the 2017 Global NGO Online Technology Report , below are 27 stats about how NGOs worldwide are using online technology. Within the report you can view the same data broken out by continent. For this year’s report, 4,908 NGOs participated. 92% of global NGOs have a website. View on SlideShare.
Write a minimum of five call-to-action and 10 stats posts/tweets with sources in advance that can be easily copied-and-pasted during the event. When live reporting in real-time on Twitter, only tweet the most interesting quotes and stats presented by event speakers. Before the Event: Content Strategy.
That said, here are 21 stats about Gen Z that nonprofits need to know about: Gen Z is expected to reach 2.6 Also, coming of age during political dysfunction, the rise of global terrorism, climate change, and increasing school violence/shootings, Gen Z is getting exposed to big issues at an early age. billion individuals globally by 2020.
If your NGO engages in peer-to-peer fundraising and crowdfunding, be sure to use a service that has integrated social sharing and social login because social media results in 1 of 3 of P2P donations. Create powerful stat and inspirational quote graphics. Your NGO consistently creates written content. Create # GivingTuesday graphics.
Like Wordle, you can share the results with your friends on social media. Today's connections fall into the following categories: Yellow: Move on from a player Green: Baseball stats, abbreviated Blue: Famous Bos Purple: First four letters of NBA team names Looking for Wordle today? Here's the answer to today's Wordle.
Simply enter your nonprofit’s name and Addictomatic then creates a page of all your search results for easy future reference. Google Internet Stats :: google.co.uk/intl/en/landing/internetstats. A collection of economic and media trends and stats. Alexa Top Sites :: alexa.com/topsites. intl/en/landing/internetstats.
But these are all the intuitive questions, the obvious stats. Applying a customer audience segment to your overall traffic, or to specific webpages grants even more donor insight than you’d get when looking at total aggregated results. How about how much time was spent on a specific page. Piece of cake. Use funnel conversion tools.
As a result, you’ll need to get comfortable with using hashtags to promote your content. It can often help to do some research, to find which hashtags will deliver the best results. You’ll also want to keep track of these stats. This will give you the best chance of getting your posts in front of your target audience.
The “vast majority” of players should now have their stats and streaks carried over. Cohen also noted that your stats are stored in local storage on your devices — the Times doesn’t have them. This will automatically redirect them to The New York Times Wordle page, carrying their stats and streaks with them.
You may discover that retweeting your own tweets results in higher engagement than tweeting the same tweet twice. Most nonprofits, however, will have to engage their followers for Twitter to produce results – but Twitter is tricky and not for everyone. Don’t be a #hashtag #spammer.
And take “thank you” a step further by showing these donors the real, impactful results of their continued support with powerful images and meaningful stats. Once you have monthly and multichannel donors, how do you retain them? Thank them. Thank them often. Thank them unexpectedly. An occasional surprise can go a long way.
Based upon the survey results of 2,780 NGOs from Africa, Asia, Australia & Oceania, Europe, North America, and South America, the data gleaned from the online survey is unprecedented and provides valuable insight into the global NGO sector and its use of online technology. The 2016 Global NGO Online Technology Report.
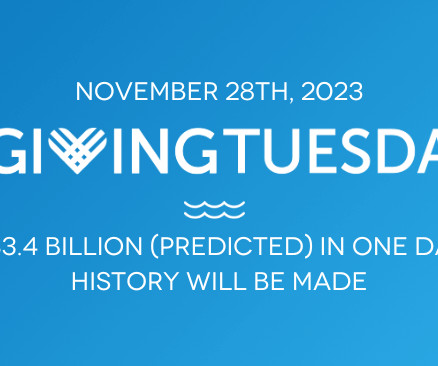
A hangover from reduced giving in 2023 continues to depress giving this year Some of the positive indicators that may help Giving Tuesday results: Low unemployment traditionally maps to increased giving. Historic Giving Tuesday Stats Year Whole Whale prediction Actual donation amount % Increase Total Participants 2024 $3.5 Billion $3.1
As you can see in the stats below, 40,000 e-newsletter subscribers drive more traffic to this blog than one million social network followers. Short subject lines that easily can be read on smartphones and tablets result in the highest open rates. Nonprofits send out an average of 3.8 Keep subject lines short.
A collaborative research project by the Public Interest Registry and Nonprofit Tech for Good, the 2016 Global NGO Online Technology Report is based upon the survey results of 2,780 NGOs from Africa, Asia, Australia & Oceania, Europe, North America, and South America. The 2016 Global NGO Online Technology Report.
nonprofit salaries began to rise in early 2020, but those numbers soon dropped back down to 2019 levels due to the pandemic, according to new research from the Association of Fundraising Professionals.
Harriett Davis from the Chicago Public Library Foundation Tell the Story of Your Mission Not Just What Your Mission is I have found that, as grant applications have gone online and gotten shorter, my strategy has become ever more important: Concise, clean, and emotive storytelling works better than stats and history. Your Voice Matters!
You see that those listed below by far got the most retweets: 1) Powerful stats that speak to your mission and programs. Unfortunately, many nonprofits tend to think that is multiple times daily (some even every hour on the hour), but that only results in lot of Twitter clutter and in most cases a colossal waste of time for your nonprofit.
From these stats, you would have retained 40% of your donors, and lost 60%. This also means sharing the results of your work. Segment out the returning donors in 2024 Divide the number of returning donors by the total number of donors the previous year. You can go even further than that simple calculation though.
Simply enter your nonprofit’s name and Addictomatic then creates a page of all your search results for easy future reference. Google Internet Stats :: google.co.uk/intl/en/landing/internetstats. A collection of economic and media trends and stats. Alexa Top Sites :: alexa.com/topsites. intl/en/landing/internetstats.
We organize all of the trending information in your field so you don't have to. Join 12,000+ users and stay up to date on the latest articles your peers are reading.
You know about us, now we want to get to know you!
Let's personalize your content
Let's get even more personalized
We recognize your account from another site in our network, please click 'Send Email' below to continue with verifying your account and setting a password.


Let's personalize your content