This site uses cookies to improve your experience. To help us insure we adhere to various privacy regulations, please select your country/region of residence. If you do not select a country, we will assume you are from the United States. Select your Cookie Settings or view our Privacy Policy and Terms of Use.
Cookie Settings
Cookies and similar technologies are used on this website for proper function of the website, for tracking performance analytics and for marketing purposes. We and some of our third-party providers may use cookie data for various purposes. Please review the cookie settings below and choose your preference.
Used for the proper function of the website
Used for monitoring website traffic and interactions
Cookie Settings
Cookies and similar technologies are used on this website for proper function of the website, for tracking performance analytics and for marketing purposes. We and some of our third-party providers may use cookie data for various purposes. Please review the cookie settings below and choose your preference.
Strictly Necessary: Used for the proper function of the website
Performance/Analytics: Used for monitoring website traffic and interactions
Campaign Monitor ] 35% of nonprofits use emojis in email, 18% animated GIFs, 12% polls, and 6% countdown timers. [ M+R Benchmarks ] Donor retention increases by 29% for offline donors when you have their email address. NextAfter ] Email Design 76% of brands use HTML email templates to design their email campaigns.
If you’ve done all the work to compile compelling stories, gather impressive statistics, and produce a visually engaging digital report, then why only use that report once? Take this engagement a step further by using interactive features like polls or questions based on the report’s findings to spark conversation and encourage reflection.
Among the organizations polled, respondents who use blogging, social media, email, a video to bolster their marketing efforts claim their marketing campaigns are more effective than those that do not. Here are a few more statistics that makes Tech Impact think content marketing is here to stay.
Only 20% of nonprofit email marketing managers raised less money from email fundraising appeals than they expected – a relatively low number compared to other fundraising tools polled in the survey. That number would likely decrease to an even lower number if the nonprofits surveyed sent email fundraising appeals more often.
Poll volunteers To stay up to date on your member volunteer’s interests and needs, you’ll want to seek and act on their feedback. You can accomplish this by polling your volunteers. Activate the Nimble Communities’ polls feature to get a clear sense of what your volunteers are thinking, and initiate change based on the feedback.
A hook can take the form of an intriguing quote, a gripping tag line, or an alarming statistic. Social media platforms offer a range of tools to help engage viewers, such as polls, quizzes, question boxes, or links. Polls and quizzes are great opportunities to include creative, low-ask material that can increase audience participation.
For our latest survey, we polled 1,200 IT leaders, representing roughly $570 billion in annual IT spending. Every year, we poll IT decision-makers worldwide about their plans for the coming year. For our latest survey, we polled 1,200 IT leaders, representing roughly $570 billion in annual IT spending.
Employment Statistics of UK’s Disabled People ]. Audience Q&As, quizzes, and polls. To get the most traction, include appropriate hashtags to increase your reach and post interactive content like surveys, polls, Q&A sessions, and more. . Stats & facts (via Infographics) [Eg. Explainers or tips .
He said that the heart wants to know the stories, not the statistics and jargon. In contrast, mobile polling offers is a more structured form of interaction. Nelson Layag , my colleague at Compasspoint, shared how they were experimenting with text polls. Collect the anecdotes and then follow up with the numbers.
That statistic becomes meaningless, however, when you consider that 52% of all data breaches that were publicly reported in 2009 did not state the number of records exposed. The lack of greater public outcry regarding the volume of data breaches is perplexing when you consider recent poll data from Gallup and Unisys.
She advises using various parts of the Grunig instrument which you can be done for free using Survey Monkey or Zoomerang or a poll on a blog. The way to do that is with statistical factor and ANOVA analysis which definitely requires an advanced level of practice and enough data. I asked her how do you measure relationships?
But in a separate poll by McKinsey , 87% of workers said that they would embrace the opportunity to work remotely when given the choice. A newer capability, the “Global Hybrid Trends Dashboard,” shows usage statistics from other companies of the same size, sector and region, providing points of reference.
A website that provides world statistics updated in real-time in categories ranging from world population to stats about energy and water consumption. TwtPoll enables nonprofits to create polls that can be shared on Twitter or any any other social network. You can also view statistics about what time people voted and from what country.
Text Poll App from MobileCause. Here’s a summary of the highlights of the conversation: Before I dive into the content, I had the pleasure of experimenting with a text polling app to find out the composition of the audience and their experience with the panel topic. I’m at the Innogive 2011 Conference today.
A BioLife poll found that 60% of people volunteer to create a positive impact. 20+ Volunteer Statistics Every Nonprofit Should Know. Use these best practices to engage volunteers on multiple levels and secure their long-term support: Give volunteers a strong sense of purpose. Explore top strategies to boost recruitment.
It combines everything a good social media manager knows to maximize on the Social Web in 2012 i.e., graphics, images, statistics, and inspirational quotes. TwtPoll enables nonprofits to create polls that can be shared on Twitter or any any other social network. is a free, do-it-yourself infographic creation tool. Wufoo :: wufoo.com.
Polls, for instance, are an excellent way to know the preference of your audience while engaging them. Posting about nonprofit fundraising statistics is a way of informing your audience and keeping them updated. Social Media Tools Make use of the tools offered by different social media platforms.
GoToWebinar enable organizations to host webinars with VOIP audio or toll free numbers, polls, analytics, and recording. Statista is a searchable portal to multiple statistics databases worldwide. Eventbrite enables users to create professional event ticketing and registration pages. Ideal for fundraising events. MeetUp :: meetup.com.
To figure out why something happened—AKA what the data you collected from descriptive analytics is telling you— consider sending surveys, analyzing reviews, looking at heat maps (showing how the user scrolls through content), holding focus groups and one-on-one interviews, and inviting supporters to take polls to ascertain donor behavior. .
One of the more chilling innovations in marketing over the past few years is called “predictive analytics” It’s this blend of statistical analysis, data mining and psychology which enabled Target to conclude that a teenage girl was pregnant before her father did. But not all kinds of audience analysis are evil.
This is a big open data effort for us and we are also excited about polling because it is a very important form of data verification currently missing in Nigeria.
Live polling during presentations can have a similar effect. With Accelevents, you process ticketing and registrations, integrate with your email marketing platforms to send out invitations and event notifications, design a fully branded webpage, track social media interactions, raise funds, and track real-time sales statistics.
So let me start right away with a poll here. So I’m just going to launch our first poll here. Because that’s a really exciting statistic. I have a couple of polls today. I’m going to end the polls and see what it looks like. ” because, again, this is a good statistic. All right.
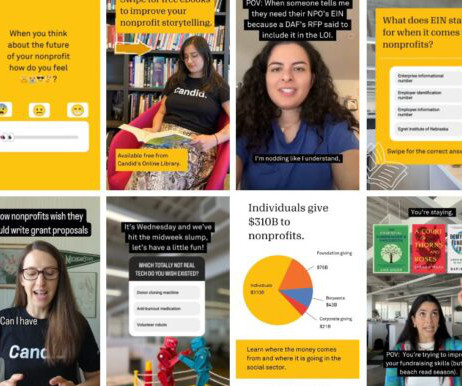
We like to transform data or previous content into trivia or an opinion poll. For example, we’ve been comparing nonprofit data to holiday-related statistics, like how much people spend on Halloween versus how much they donate to charity in October. If you lead with data the first time, lead with the quote the next.
You can also get statistics on how fans interact with your page, helping you determine the most effective communications strategies. Some options include videos, podcasts, interviews, polls, insightful status updates, and more. Add Unique, Interactive Content. Need help improving your social media skills? Click here to learn more.
Galileo monitors the AI development processes, leveraging statistical algorithms to pinpoint potential points of system failure. The MLOps Community poll found that convincing stakeholders when a new model is better, for example, remains an issue “at least sometimes” for over 80% of machine learning practitioners.
On the app, students can publish text posts, polls and photos without a username or identifying information attached. Regardless, Fizz claims that over half of its users are engaging with the app every day, an impressive statistic in itself. Like Reddit, classmates can upvote or downvote what they see in their feed.
Pervasive BI remains elusive, but statistics on the category reveal that about a third of employees use BI tools for analytics to inform strategy. By handling large amounts of data to analyze and benchmark lines of business, BI promises to help identify, develop, and otherwise create new revenue opportunities.
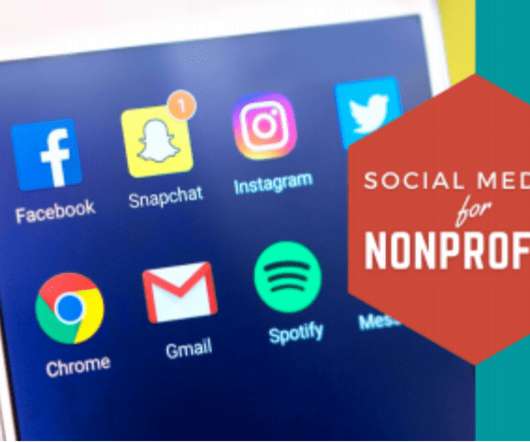
Plus, fundraising statistics. Social media polls. Social media platforms like Instagram, Facebook and Twitter allow you to send out polls and questions to your followers. show that every generation, from Millennials to Baby Boomers, prefers donating on online platforms.
With the ability to present slides, share links and desktops, conduct polls, and create and store meeting notes, virtual meetings can be more productive than meetings in person. Attendee polling and statistics. Web conferencing excels where rich collaboration and close interaction are needed and teams are dispersed.
Nearly a year ago, my colleagues Fraser Green, Todd Jamieson, and I decided we could no longer simply work with unreliable or incomplete statistics and benchmarks about nonprofit websites in Canada, and that you shouldn’t have to either. The goal was simple: determine website baselines and benchmarks for the Canadian charitable sector.
Listen to your supporters’ needs by sending surveys and polls where they can provide feedback. Demonstrate gratitude by not only sending thank-you notes, but also showing supporters how their contributions make a difference with stories and statistics. Be sure to actively incorporate their comments so they know their opinions matter.
and LeanIn.Org which polled more than 65,000 North American employees, 42% of women and 35% of men reported feeling burned out often or almost always in 2021, compared to 32% of women and 28% of men last year. In a 2021 study from McKinsey & Co. I’d guess that the 2022 numbers will just continue to grow. of females and 23.8% in 2019.
However, some webinar platforms have a real-time polling feature, the virtual equivalent of asking people to raise their hands if. The poll revealed that revealed 40% were beginners/novices and 60% intermediate or experts. Can we get the full site for the twitter statistics? (Yes Yes check here ).
Fun and immersive content that invites audience participation, like quizzes, polls, and interactive infographics, boosts engagement and interaction. Most of these programs use data that’s a few years old, meaning any facts, statistics, or best practices it recommends could be inaccurate (or even just entirely made up).
With individuals giving the most of any group polled, this was particularly worrying because individuals make up the majority of fundraising dollars given in a year (64% of total giving in 2022). Want more statistics you can use to make data-backed decisions at your nonprofit organization? Individual giving totaled roughly $319.04
Engage with your followers by asking for feedback, running polls, and sharing user-generated content. Use data and statistics to show the impact of your programs and how donations are making a difference. These generations are tech-savvy and spend a lot of time on social media platforms.
Using interactive content, such as polls, surveys, and quizzes, could enrich the perspective of your nonprofit and help to fuel more relevant content. Big Brothers Big Sisters has leveraged video successfully to emphasize the impact “bigs” have on “littles.” Don’t underestimate the value of user-generated content.
Statistics show that interactive content drives online conversions and leads to 52.6% Plus, these days, most people will look at your website on their mobile devices—statistics show that over 90% of internet users access the web on their phones. User surveys and polls. higher engagement than static content.
Before the advent of simple survey software, which leveled the playing field, surveys were run by businesses and organizations large enough to have a statistical department or a partnership with a university. Surveys are often an advertising gimmick, a marketing ploy, or a general nuisance.
Bureau of Labor Statistics, while emergency department wait times increased. A 2021 Kaiser Family Foundation/Washington Post poll found that about 3 in 10 healthcare workers considered leaving the profession while about 6 in 10 said pandemic-related stress had harmed their mental health.
Dig Into Your Data: Look at your statistics and find out which subject lines are generating the highest open rates, and which articles and subjects are generating the most clicks. Get Interactive: Ask people to take a poll or share a story. Here are some useful tips to increase your e-newsletters performance rates.
Listen to your supporters’ needs by sending surveys and polls where they can provide feedback. Demonstrate gratitude by not only sending thank-you notes, but also showing supporters how their contributions make a difference with stories and statistics. Creating experiences that fulfill their needs. Frequently expressing appreciation.
Worldometers is a website that provides world statistics updated in real-time in categories ranging from world population to stats about energy and water consumption. TwtPoll enables nonprofits to create polls that can be shared on Twitter or any other social network.
We organize all of the trending information in your field so you don't have to. Join 12,000+ users and stay up to date on the latest articles your peers are reading.
You know about us, now we want to get to know you!
Let's personalize your content
Let's get even more personalized
We recognize your account from another site in our network, please click 'Send Email' below to continue with verifying your account and setting a password.


Let's personalize your content