This site uses cookies to improve your experience. To help us insure we adhere to various privacy regulations, please select your country/region of residence. If you do not select a country, we will assume you are from the United States. Select your Cookie Settings or view our Privacy Policy and Terms of Use.
Cookie Settings
Cookies and similar technologies are used on this website for proper function of the website, for tracking performance analytics and for marketing purposes. We and some of our third-party providers may use cookie data for various purposes. Please review the cookie settings below and choose your preference.
Used for the proper function of the website
Used for monitoring website traffic and interactions
Cookie Settings
Cookies and similar technologies are used on this website for proper function of the website, for tracking performance analytics and for marketing purposes. We and some of our third-party providers may use cookie data for various purposes. Please review the cookie settings below and choose your preference.
Strictly Necessary: Used for the proper function of the website
Performance/Analytics: Used for monitoring website traffic and interactions
The first step to identifying ways to increase your reach and performance on Facebook is identifying which analytic and statistics you should be paying attention to. The post Better Understanding Nonprofits And Their Facebook Metrics appeared first on Tech Impact Blog - Leaders in Non-Profit Technology.
Overhead to program expense ratio Having money left over to reinvest at the end of the year Programmatic statistics related to mission impact As with many multiple-choice tests, there is only one answer here that makes sense: programmatic statistics related to mission impact.
Building donor awareness through personal stories Personal narratives make statistics meaningful and memorable. Organizations that share success metrics — like the number of residents who opened their first bank account or completed financial education programs — demonstrate direct donor impact on community stability.
Here are a few more statistics that makes Tech Impact think content marketing is here to stay. 53% of respondents to this survey cited website traffic as the metric most important to them. 25% of nonprofit professionals are currently utilizing a content marketing strategy. Second being brand awareness, with engagement coming in third.
And the proof is in the email statistics. Use infographics or statistics – anything that helps visualize the impact made. . There are several reasons why you should do something about inactive subscribers: Email services use email metrics to rank your emails in the inbox. It skews your email marketing metrics.
Keep it Simple Many people don’t feel comfortable with numbers and statistics. To highlight the significant metrics, describe the relationship between the budget, the plan, and initiatives that are important to members. Complex financial statements can easily overwhelm new learners. Bring that connection to life.
Especially if we look at the latest social media statistics and the changes here, it becomes clear that less is more. Measurement overwhelm – Don’t measure every social media metric you can. It’s important to realize why we’re looking at these metrics in the first place, so that we can choose the right metrics to focus on.
There are countless social media metrics to track depending on the platforms you use regularly, and your nonprofit needs to recognize which ones truly matter to gauge and improve your performance. . Two relatively recent social metrics worth monitoring are saves and shares. Relevant statistics . Why Saves Matter for Nonprofits.
I’m not talking about so-called engagement metrics like “clicks,” “likes,” and “follows” (what the Agitator-DonorVoice gurus call the empty calories of fundraising/marketing). TIP 12: Highlight the emotional aspect of your impact by telling simple, compelling stories; don’t just recite a bunch of statistics.
One of the most important statistics to glean from this whole process is your donor retention rates, or, the number of donors who donate to your nonprofit each year. Now that you’ve collected pertinent data, and discovered some interesting metrics, your nonprofit has the opportunity to ask and answer some important questions.
Understanding how the metrics below relate to your nonprofit will help you discern which demographics to target during your next donation campaign. Pay attention to these statistics when evaluating who your loyal donors are. Previous giving to your nonprofits. This can be broken down into 3 sections.
Before you start, think about what statistic is most important to your nonprofit in the immediate future, and what goal will can be accomplished by gathering that information. Here are the 3 steps your nonprofit needs to get started measuring and reporting on meaningful data today. Start Small. Start measuring, and reporting.
Understanding Program Management Statistics Whether you’re assessing future needs or composing an annual report to share with donors, funders, and community members, conducting impact assessment is crucial for tracking progress and driving continued on-the-ground impact. Project your future needs and allocate resources accordingly.
This also shows how the models compare on standard performance metrics and informative visualizations like Dual Lift. With DataRobot AI Cloud, you can see predicted values and accuracy for various metrics for the Champion as well as any Challenger models.]. Model Observability with Custom Metrics.
Even with the threat of recession on the horizon, these statistics indicate that the Great Resignation does not appear to be a passing trend. The Bureau of Labor Statistics projects that the unemployment rate will remain low, at 3.9% If you haven’t been tracking workforce statistics, now is the time to begin.
Understanding how the metrics below relate to your nonprofit will help you discern which demographics to target during your next donation campaign. Pay attention to these statistics when evaluating who your loyal donors are. Previous giving to your nonprofits. This can be broken down into 3 sections.
Define Your Metrics and Create a Social Media ROI Spreadsheet. In the far left column of the spreadsheet, list the metrics that you want to monitor. Finally, pick a day of the month to begin and enter the baseline metrics for the first month, then enter your progress for that month on the same day of every month thereafter.
You don’t want to recite a list of statistics, but sharing the facts about your mission and your outcomes—plus the work still to be done in non-election years—grounds your pitch in reality, not outrage. Doubling up (especially with a passionate volunteer) can be an effective strategy to convey a sense of collective activism.
First , make sure you are using an emarketing tool that allows you to track all of the basic email statistics (open rates, clicks, actions taken, money raised, etc). Second , use the tool correctly so you can both capture the metrics you need and use the data to make educated decisions about what to do next.
“Our statistics team then used the clean, updated data to model the best offer for each household.” 6 key metrics that can help SaaS startups outlast this downturn. ” 6 key metrics that can help SaaS startups outlast this downturn. ” Investor’s advice during a downturn: Don’t panic.
These are statistics you can monitor to assess the strength of your business model and organizational health. Lead Executive : Provides operational leadership for initiatives, interfaces with the Oversight Group, ensures coordination, and monitors performance metrics.
Create custom graphics for powerful quotes, statistics, and call-to-actions. In this example, @Codeorg features their logo with an inspirational quote from a supporter: Statistics and fact graphics also work well on Twitter. In this example from @PopnMatters , six facts are featured and engagement is high for this graphic.
On the businesses’ side, Double the Donation’s statistics speak for themselves: 55% of employees say they would take a lower salary to work for a socially responsible company. Then, you can use these metrics for decision-making and reporting. But the benefits don’t stop with the communities and nonprofits receiving assistance.
Whether working in Slack or looking at your personalized Pulse homepage, you can see the metrics and KPIs you need to do your work. Your personalized Tableau Pulse homepage displays a summary of the key metrics that you follow. Below the summary, each metric card includes a key metric, a visualization, and AI-generated insights.
Analyzing your data may require pulling information from multiple sources and seeing what can be learned using descriptive and inferential statistics. Choose new metrics Once you have identified the data you already have, it may be time to select new metrics that better align with your goals.
Data profiling gives us statistics about different columns in our dataset. These profiles help you track changes in your data, set rules to make sure the data is correct, and show you summary statistics in an easy way. They include statistics like averages, counts, and distributions. That’s where condition count metrics come in.
from 2016–2018 and added a number of financial metrics to the spreadsheet. The Moderating Effect of Mission Statement Polarity on Performance , we used a package in the statistical software R Studio to measure the emotional polarity of the 200 mission statements. We also downloaded their IRS Form 990s?from For our first project,?
Their key responsibilities include: Developing donor appreciation strategies that fit your audience Creating marketing materials that encourage long-term donor engagement Tracking donor engagement metrics and identifying improvement areas They may also brainstorm additional ways for donors to contribute to your mission.
Bureau of Labor Statistics predicts that the employment of data scientists will grow 36 percent by 2031, 1 much faster than the average for all occupations. Bureau of Labor Statistics. Other organizations are just discovering how to apply AI to accelerate experimentation time frames and find the best models to produce results.
Then we recorded key metrics from their IRS Form 990s from 2016-2018. Once we had that information, we applied a statistical method called exploratory factor analysis to uncover themes that might be present in the data set. Once identified, these themes could similarly be compared statistically to spending and earning. .
There are very well established best practices, standard metrics that are tracked, widely accepted and proven statistical data to measure your effectiveness by and countless bits of information on the web to teach us how to do email marketing and communication well.
Treat your ambassadors as insiders who are doing much more than growing vanity metrics – they are helping to steer a movement. . You’ve determined your objectives based on where your organization looks to go and how social media helps to get it there. Share that.
To get started, take a look at your email statistics over the past year to see trends in open rates from mobile devices. Even more, study your mobile click-through rates – if there’s a big gap in this metric between desktop and mobile, it’s time to make a change.
In April 2012 NTEN worked with Idealware to conduct a survey of nonprofits about their relationships with data, and what we found was a large dichotomy—either they were doing a lot with their metrics or not much at all. Here is a sample of what we found: 99% of respondents track some sort of metrics.
If you’re a founder building a startup in the cloud and pinning your revenue on subscription-based services, annual recurring revenue (ARR) is an essential metric you need to understand. If you are seed through Series B, this session is for you.
TiDE: A simple MLP architecture for fast and accurate forecasting Deep learning has shown promise in time-series forecasting, outperforming traditional statistical methods, especially for large multivariate datasets. In such scenarios, the standard approach is to use the same target metric as the loss function while training.
With access to government and institutional data, it’s possible to analyze key metrics, measure progress against goals, and create responsive public policies that can deliver profound benefits to society. The dashboard goes beyond hospitalizations and mortality metrics, showing insights about various aspects of Dutch society and behavior.
In this guide, we’ll walk through three key social media fundraising metrics, as well as how you can improve them: Social Media Engagement Rate Conversion Rate Social Media Return on Investment Ready to tap into the full potential of social media fundraising?
Ashwin Ramasamy is the co-founder of PipeCandy , an online merchant graph company that discovers and analyzes business and consumer perception metrics about DTC brands and e-commerce companies. Here are some stand-out statistics: 2022 is turning out to be a phenomenal year for enterprise e-commerce platforms. Contributor.
Beyond data pipelines and statistical methods, and experimentation infrastructure relies on analytical workflows often sourced from difficult-to-configure cloud environments. “Especially in tough recession markets, the C-suite needs their product teams to probably drive business metrics like revenue.
While some works report the classification accuracy on the samples to unlearn, others report distance to the fully retrained model, and yet others use the error rate of membership inference attacks as a metric for forgetting quality [ 4 , 5 , 6 ]. The goal of the competition is twofold.
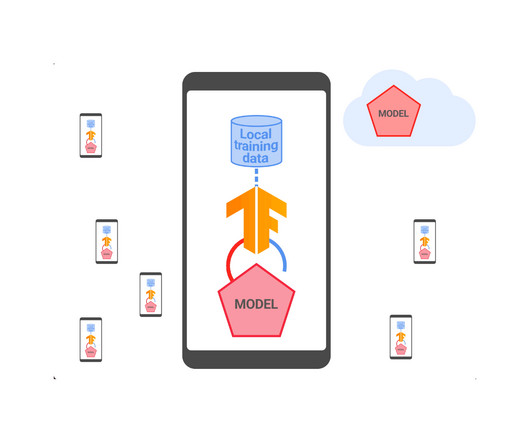
We have deployed statistical methods to effectively auto-tune such a time window in an adaptive way, resulting in improved protocol throughput. Aggregating everything via secure aggregation A typical federated training system not only involves aggregating model updates but also metrics that describe the performance of the local training.
It calculates the window where someone could get pregnant based on statistical modeling. “It The statistical method it uses was originally developed and tested by researchers at the Institute for Reproductive Health at Georgetown University and a company called Cycle Technologies, and acquired by Clue in 2019. “Our
Key fundraising metrics like donor retention rate, donation frequency, and fundraising return on investment (ROI). These metrics provide a comprehensive, bird’s eye view of your organization’s fundraising and outreach efforts that you can use to craft a new strategy. The characteristics of your donor base.
We organize all of the trending information in your field so you don't have to. Join 12,000+ users and stay up to date on the latest articles your peers are reading.
You know about us, now we want to get to know you!
Let's personalize your content
Let's get even more personalized
We recognize your account from another site in our network, please click 'Send Email' below to continue with verifying your account and setting a password.


Let's personalize your content