This site uses cookies to improve your experience. To help us insure we adhere to various privacy regulations, please select your country/region of residence. If you do not select a country, we will assume you are from the United States. Select your Cookie Settings or view our Privacy Policy and Terms of Use.
Cookie Settings
Cookies and similar technologies are used on this website for proper function of the website, for tracking performance analytics and for marketing purposes. We and some of our third-party providers may use cookie data for various purposes. Please review the cookie settings below and choose your preference.
Used for the proper function of the website
Used for monitoring website traffic and interactions
Cookie Settings
Cookies and similar technologies are used on this website for proper function of the website, for tracking performance analytics and for marketing purposes. We and some of our third-party providers may use cookie data for various purposes. Please review the cookie settings below and choose your preference.
Strictly Necessary: Used for the proper function of the website
Performance/Analytics: Used for monitoring website traffic and interactions
Candid released its free Demographics API to help organizations easily standardize and integrate their demographic data collection. This initiative allows nonprofits to share demographic information one time on their Candid profile, where funders, researchers, donors, and other stakeholders can easily access it.
To date, over 75,000 nonprofits have contributed their demographic data to Candid, representing an increase of 50% since 2022. Were proud of the impact Demographics via Candid has made so far, and it could not have been done without the dedicated efforts of nearly 200 partners.
Demographic data is critical to helping our sector better understand and meet the needs of diverse communities. Foundations increasingly recognize the importance of recipient organizations’ demographics in informing their grantmaking process to ensure their grants are equitably distributed and impactful.
Heres what we learned: Demographic Shifts are Accelerating Demographics are playing a significant role in shaping membership trends. Associations Are Learning to Make Data-Driven Decisions Analyze demographic and membership trends. To explore this more, I hosted a webinar through UST Education on the membership cliff.
nonprofits are engaging with demographic data about their staff, leadership, and board members—but what does quality demographic data look like? A study we recently conducted on behalf of Candid found that, in line with previous research , nonprofits are using demographic data to inform their work and sharing it.
What’s the demographic composition of the U.S. Based on data from 59,550 public charities that shared demographic data between July 2019 and January 2024, 47% of all staff identify as white, 24% as Black/African American, 19% as Hispanic/Latino, 6% as Asian American/Pacific Islander, 1% as Native American, and 4% as multiracial.
Today, Candid released our latest research manual, Analyzing Candid’s demographic data. nonprofits currently share some demographic data about their staff and board with Candid. As a result of our Demographics via Candid efforts, this number has increased significantly over the past two years. Over 62,000 U.S. For example, U.S.
As more funders seek to use demographic data to inform their grantmaking decision-making, 125 partners have now joined the Demographics via Candid movement. The process and timing of asking nonprofits for demographic data matters. The process and timing of asking nonprofits for demographic data matters.
What about membership, how has it grown or changed or shifted demographically (or even geographically) in the last five years, and what could that mean? Which way are enrollments that certification you offer trending? Where should you have your next conference, how far are people willing to travel? Doesnt that sound nice?
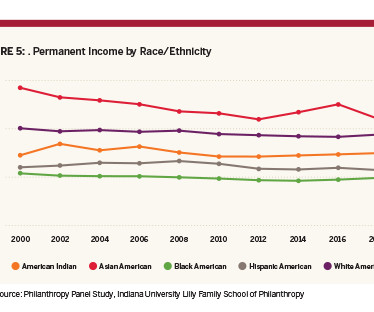
Here are three key findings from the report and how your nonprofit can begin to overcome the associated hurdles to reaching new demographics to support your cause. The Indiana University Lilly Family School of Philanthropy released “The Giving Environment: Giving Trends by Race and Ethnicity” report.
As the demographics shift, younger generations require more personal and causal connections for their philanthropy. For this reason, Giving Tuesday has become ineffective. Here is how organizations can position themselves to encourage donors to give year-round.
Millennials and Gen Z are both nuanced demographics. There are various areas to dig deeper into, but some things worth exploring about these demographics include the following. You can use data analytics platforms to segment your target demographics into personas, allowing you to tailor general outreach to be more relevant.
Learn practical techniques for leveraging geographic information system (GIS) technology to pinpoint donor demographics, tailor outreach campaigns, and maximize fundraising impact through targeted engagement. Sign up to watch the webinar.
Tips to Step Up Your Salesforce Game Supercharge Segmentation with Advanced Analytics: Go beyond basic demographics: You’re likely already segmenting by basic factors like donation amount or location. Learn more about how to use the worlds best tech to power your nonprofit. Get started ! Dive deeper!
So, how can nonprofits connect with this growing demographic? And the younger the generation, the larger the percentage, with nearly 21% of Gen Z and almost 11% of millennials identifying as LGBTQ+.
They explore how nonprofits should analyze data and trends in giving, as well as exploring a nonprofit's donor segments and demographics in order to better engage donors.
Different demographics tend to favor different platforms, so nonprofits should consider factors like age and interests when deciding where to focus their efforts. Step Five: Understand the Target Audience and Adjust Accordingly For nonprofits to succeed on social media, they must understand their audience and know where to find them.
Changing demographics The number of U.S. Changing demographics The number of U.S. Following a long-term demographic shift , record numbers of Americans are reaching retirement age. There are also health benefits for those who start volunteering much earlier in life. This change has been gradual.
This combined demographic is highly philanthropic and very relational, and they live and breathe inside the digital world. In this edition, we talk about Millennials and Gen Z's, and how critical they are to the future of EVERY single nonprofit. Want to learn how to connect? We have answers for you inside of this month’s ZGIVE INSIDER!
Golf fundraisers give sponsors unique exposure to a highly-desirable, affluent demographic. At the core of a golf tournament’s fundraising power are sponsorships. On average, golfers have a higher than average net worth and household income.
Even better, the golfer donor represents an affluent, influential demographic that you want represented in your organization’s donor database. Fundraising boils down to two simple things: finding new donors and keeping existing ones. Great news—golf tournaments are avenues to successfully do both!
Melissa’s Donor Look-alike Report provides demographic elements to help you focus on your ideal target audience and reach more donors just like your best ones. Simply upload your file - we’ll analyze it, match specific criteria to your records and send you the results.
Inability to Forecast Trends : Are you tracking trends in membership demographics, engagement, and industry needs? Lack of Performance Tracking : Do you know how your programs, events, and member engagement initiatives are performing? Without data, its difficult to measure success or identify areas for improvement.
Melissa’s Donor Look-alike Report provides demographic elements to help you focus on your ideal target audience and reach more donors just like your best ones. Simply upload your file — we’ll analyze it, match specific criteria to your records and send you the results.
Better understand the core demographics and interests of your donors. Learn which personality types are your best and worst donors and how to tailor content to them. Visualize the usefulness of targeting different geographic areas. See how your model performs. Obtain 9 easy-to-implement Action Tips. And much more.
Melissa’s Donor Look-alike Report provides demographic elements to help you focus on your ideal target audience and reach more donors just like your best ones. Simply upload your file - we’ll analyze it, match specific criteria to your records and send you the results.
One demographic that seems particularly susceptible to sports betting addiction, according to the Intuit Credit Karma study, is Gen Z37% of whom reported being addicted. Thats 14% more than the number of respondents across all age demographics claiming to be addicts.
Demographics and networks are important, and golf’s demographic tends to include high-capacity donors with powerful networks. Indeed, golf outings are having something of a renaissance in a time when corporate connections, donor engagement, and outreach efforts are perhaps more important than ever. 1) Focus on audience.
million monthly active users and 800,000 daily active users, many of whom are in the investor-coveted Gen Z demographic. Launched in September 2024, Yope has grown exponentially over the past six months, now boasting 2.2 The company also claims that 40% of users are still active on the app seven days after installing it.
GivingTuesday is the day of the year where you find people of all ages and all demographics opening their hearts and their wallets to donate to causes and organizations that are important to them or to find new initiatives to support. Giving habits vary by generation and demographics. According to Celeste Flores, director of the U.S.
Today’s demographic conditions also make planned giving especially worth investing in, as aging generations are poised to pass down record amounts of wealth to their heirs and favorite causes in the coming decades. What Motivates Planned Giving? Additionally, remember that “planned gifts” are a diverse category.
What are their demographics (age, gender, location, industry, interests)? Do you know what types of donors are most likely to give to your organization? Take a look at your current donors and prospects… who are they? Where did they come from? Do you see any patterns? Create a number of “donor profiles” for your organization.
It is of paramount importance that nonprofits think of cryptocurrency not only as a payment method, but as a donor demographic. No Donor Forms: If you put a wallet address directly on your site, you won’t get donor data. Where do charities find cryptocurrency donors?
Download Melissas 2025 Solutions Catalog to see how 40 years of expertise in address verification and data quality can help you clean up your donor data, prevent fraudulent data entry, and enrich your data with demographic and geographic appends for great AI outputs.
Audience Insights: Look at your audience insights on Facebook and write down your key demographic information. Phase 2: Content, Cost & Creation. Phase 1: Identify Your Audience, Partner(s) & Content. What content would help serve and provide value to your audience right now?
First ask yourself, what demographics do these stakeholders fall into? Because there are so many social media platforms to choose from, you have the opportunity to choose which ones make the most sense for your organization. Consider your target donor audience as well as the constituents you serve.
A demographically representative sample was screened for evangelical beliefs and lack of non-Protestant affiliation. Even if younger evangelicals do increase their giving, there is nothing saying that giving will automatically go to traditional sources, such as charities and churches, they wrote.
They think: “many of our supporters are women aged 50-60 and are interested in animals, so let’s target that demographic on Facebook.” But Facebook has a lot more information about its users than the relatively blunt demographics that your database can provide.
Choose your social media platforms based on your supporters’ demographics and the demographics of supporters you want to attract. If you’re on too many platforms, you could be stretching your content too thin, which will lead to you posting just to post instead of creating intentional content.
Can you look at previous purchasers, create demographic profiles and market to others like them? Is someone from the AMS team included in discussions about revenue generation at your organization? Can you make e-commerce on your website more like Amazon with its recommendations and use of purchasing? Track progress, celebrate results.
Many factors are important to consider: tenure, type of membership, demographics, how the member was acquired, how the member is engaging with your association, and more. Demographic/Career Info. Are you using it to increase revenue and lower costs per renewal? Retention rates aren’t one dimensional.
We organize all of the trending information in your field so you don't have to. Join 12,000+ users and stay up to date on the latest articles your peers are reading.
You know about us, now we want to get to know you!
Let's personalize your content
Let's get even more personalized
We recognize your account from another site in our network, please click 'Send Email' below to continue with verifying your account and setting a password.


Let's personalize your content