This site uses cookies to improve your experience. To help us insure we adhere to various privacy regulations, please select your country/region of residence. If you do not select a country, we will assume you are from the United States. Select your Cookie Settings or view our Privacy Policy and Terms of Use.
Cookie Settings
Cookies and similar technologies are used on this website for proper function of the website, for tracking performance analytics and for marketing purposes. We and some of our third-party providers may use cookie data for various purposes. Please review the cookie settings below and choose your preference.
Used for the proper function of the website
Used for monitoring website traffic and interactions
Cookie Settings
Cookies and similar technologies are used on this website for proper function of the website, for tracking performance analytics and for marketing purposes. We and some of our third-party providers may use cookie data for various purposes. Please review the cookie settings below and choose your preference.
Strictly Necessary: Used for the proper function of the website
Performance/Analytics: Used for monitoring website traffic and interactions
Here are seven tech trends nonprofit golf tournament planners should watch for their 2025 events. Online registration powered by a golf event management platform saves tournament organizers a ton of time and effort with automated receipts and data management.
It remains all too common for associations to ignore vital data points as they strategize for the future. The inertia of decades of existence often precludes a data-informed state, instead relying on anecdote, trusting in the gut feeling of longtime employees or volunteers, and the way things have always been done.
Set Clear, Measurable Goals: Define success metrics that are specific, actionable, and adaptable as your association grows and evolves. How.orgSource Can Help: We work with associations to create actionable, future-focused strategies that align with industry trends and member needs, ensuring your vision is resilient and achievable.
orgSource Digital Trends Survey highlights the essential strategies associations need to thrive in the coming years. Conduct surveys, gather feedback, and use data insights to understand what matters most to them. Set Clear Goals and Metrics : Define what success looks like in terms of member engagement, satisfaction, and retention.
Our recent.orgSource Digital Trends Survey reveals several key gaps in how associations are currently using technology to meet member needs and adapt to industry shifts. Thats why we specialize in helping associations build digital strategies that address inefficiencies, improve member engagement, and leverage data for growth.
This year, youre starting on the right footwith data-driven insights , realistic, air-tight goals, and the perfect plan to reach them. By focusing on the metrics that matter and setting clear goalsbecause you cant improve what you dont measure. 2) Calculate donor lifetime value : LTV gives you the data to decide where to invest.
Estimated Reading Time: 3 minutes 5 Fundraising Metrics Every Nonprofit Should Track This Year In todays data-driven world, you cant afford to guess whats working and whats not in your fundraising efforts. Tracking the right metrics helps you understand your impact, refine your strategies, and maximize your resources.
By Stephanie Wallace , Marketing Specialist, Keela – a complete software solution for nonprofits looking to grow revenue, centralize and manage data, and deepen donor engagement. By automating tasks and centralizing data, these tools have saved organizations time and resources.
Step 2: Explore – In addition to reviewing the data in their dashboard, IAEE asked members in its annual member survey and in post webinar surveys about topics they’d like to learn more about. Once the team aggregated the data and they were able to form a hypothesis, test it and confirm a need.
How to Leverage LMS Data Analytics for Better Decision-Making in Corporate Training GyrusAim LMS GyrusAim LMS - In today’s competitive business landscape, Learning and Development (L&D) programs are key drivers of employee growth, retention, and overall business success. billion in 2020–21.
Those traditional metrics are a good starting point, but often do not tell the whole story. As we discussed in our recent blog post about retention, data isn’t one dimensional. Data can help you think more broadly to identify a valuable product based on your specific goals and success metrics. Are your sales seasonal?
We believe strongly in this capability because it lowers the barrier to entry for new users, and we believe that data is for everyone. The release of Tableau Pulse introduces some redundancies to the platform, including search-based analytics with Ask Data and Tableau Metrics. In 2020, Metrics in Tableau launched.
.” Stephen Few, data visualization expert On a single day, Facebook users share 2.45 The competition for eyeballs is fierce, but data visualization offers a way to stand out. The competition for eyeballs is fierce, but data visualization offers a way to stand out. Why is data visualization so effective?
In this post, I’ll walk you through why that’s important and what metrics you should measure. . This will help you understand donor trends, such as if you reached a new audience, if the average gift amount increased, etc. . Goals and metrics . 11 metrics to evaluate your end-of-year fundraising campaign . Total revenue.
The team at Association Analytics often hears questions like, What exactly is data analytics? With analytics, you try to aggregate data over time and across data sources for a 360-degree view of your members and their activities. Collect Your Data Even If Its Not Perfect. Your plan should start by collecting your data.
Fortunately, data can help you make good decisions during uncertain times. Why data should drive your decisions Many key industries, including retailers, manufacturers, and healthcare organizations, use data to inform decisions. To be successful despite uncertainty, you must let data drive your decisions.
For associations offering courses and certifications, having basic metrics on things like participation counts and revenue are critical – but just the start. The Nucleus data analytics platform has two dedicated and ready-to-use packages for precisely these types of analysis: Learning Management and Certifications.
Leveraging your data throughout the entire member journey can impact your association and your members. From successfully converting non-member audiences into members, to your membership engagement strategy, to events and non-dues revenue, data can inform every step along the way.
A major part of connecting with these individuals and optimizing the giving experience is utilizing the data you collect about their giving trends to inform your future fundraising decisions. . A big part of this is understanding and leveraging data to inform any changes they make to the donor experience.
What is the state of your member data? According to Community Brands 2022 Association Trends Study, while data analytics is a higher priority for organizations, just one-third of association professionals report their data is excellent or very good. Reporting on the state of member data.
I hear myself repeating something similar when I host an annual webinar on emerging datatrends for higher ed annual giving programs. With my co-host, Brian Kish, we pour over data from Blackbaud’s donorCentrics® and Fundraiser Performance Management. Maybe we need to focus our attention on narrower metrics.
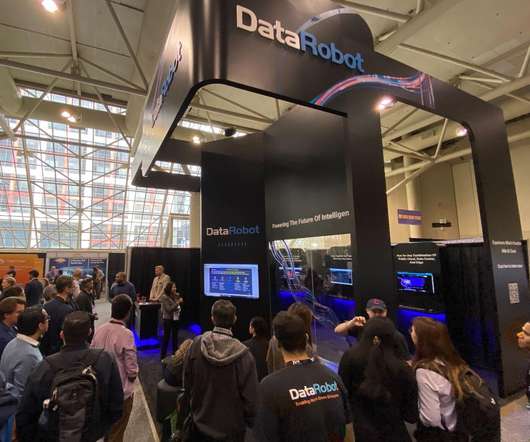
Organizations are looking for AI platforms that drive efficiency, scalability, and best practices, trends that were very clear at Big Data & AI Toronto. DataRobot Booth at Big Data & AI Toronto 2022. Monitoring and Managing AI Projects with Model Observability.
As discovered in the Global Trends in Giving Report , the.org domain is by far the most trusted domain for nonprofit website and email communications. LinkedIn Analytics offer an important key metric that Facebook, Twitter, and Instagram do not – the ability to view clickthroughs on organic posts. Gmail, Yahoo, etc.
According to the Community Brands 2022 Association Trends Study, over half of association professionals say investing in business intelligence and data analytics is a top priority, yet only one-third would rate their organization’s data as excellent or very good. What is the state of your association’s data?
But to fully reap the benefits of AI, companies have to be able to trust and act on their data. That’s why it’s never been more essential for companies to create a comprehensive analytics strategy and become data-driven. But what does it mean to be data-driven? It means nurturing a culture that embraces data-driven thinking.
Having measurable metrics is crucial to pinpoint what is and isn’t working in training development programs. Measurable training metrics may include completion rates, engagement rates, course evaluations, and assessment scores. It helps them know if they are using time and resources wisely.
The Fundraising Effectiveness Project ’s (FEP) Quarterly Fundraising Report analyzes year-to-date trends in fundraising from individual donors, based on sample data from GivingTuesday and the Association of Fundraising Professionals’ Growth in Giving database. It remains to be seen whether this trend continued into 2024.
Vivek Murthy says , Its important to start with acknowledging that young men and boys are actually going through a crisis of their ownthe data is actually quite clear that young men and boys are actually falling behind on many metrics. These are the issues where the data is most concerning, and where action is most urgently needed.
What the Data Says Many nonprofit organizations build their websites based on hunches about what they think their unique audiences want to see. While its true you know your audience better than anyone, you can greatly increase your websites return on investment (ROI) by taking a data-driven design approach.
More posts by this contributor Use DORA metrics to support the next generation of remote-work models Insider hacks to streamline your SOC 3 certification application While the past few years saw a big drive towards caring for employees, the last months have seen the pendulum swing in the other direction.
Brent Merritt is a digital strategy consultant at Metric Communications and blogger at The Caliper. Running Facebook fundraising ads is an excellent way to reach your target audience and optimize for donations while generating data that allows you to measure your success. 5) Select metrics and monitor campaign performance.
Does your association have a data governance policy? In our data-driven world, governance is crucial in maintaining the integrity, accuracy, and security of your organization’s data. But according to the Community Brands 2022 Association Trends Study , only 39% of association professionals have one!
But behind that simplicity is a data powerhouse that is driving the success of the platform. They used Salesforce to develop a flexible infrastructure that allows their team to manage the program and data. These dashboards give perspective on both the individual case and the broader thematic trends.
However, troubling trends have emerged in two key areas: 1) The share of grantmakers providing technology and tools for nonprofits has decreased to 20%, from 23% in 2022; and 2) the share grantmakers willing to removing funding restrictions has also declined, to 30%, from 34% in 2022. Seek out capacity-building opportunities.
Applications, proposals, progress reports, impact metrics – the data collected throughout the grantmaking lifecycle is vast and ever-growing. While this data holds immense potential to improve decision-making and maximize impact, harnessing its power can be a challenge.
The annual M+R Benchmarks Study is a wide-ranging exploration of digital fundraising, advocacy, and marketing data. Across channels and platforms, we end up with answers about what is working and what’s not, trends in nonprofit strategies, and insight into supporter behavior. . Your data security and anonymity are VERY IMPORTANT to us.
Does the platform provide powerful tools for data analysis, insight and built-in reporting for nonprofit metrics? Can the development office customize workflows and notifications when a donor is lapsing to help you determine the root cause and how to turn the trend around? Is the technology popular in the market?
Data show that married couples are most likely to give, followed by single women, and then single men and that holds true not just during a 20-year period but for each individual year tracked. Some of the data changes over time because according to the U.S. The data also shows more young adults are living at home with their parents.
Mobile giving trends Best practices for raising more through mobile giving How mobile giving technology can help What is mobile giving? Ensure data flows smoothly from your mobile fundraising platform to your donor database to track donor information and follow up after your campaign. Well cover: What is mobile giving?
Going Beyond Basic Metrics Learning analytics goes beyond basic metrics to offer you a deeper understanding of course performance and learner engagement. This data-driven approach ensures that learners receive the best possible educational experience, with high-quality instructors driving engagement and knowledge retention.
Fortunately, with data, we can better understand members’ behavior and which marketing channel is most effective to reach our members. This is how you organize and describe your data. If you don’t tag your data accurately, it will be difficult to actually see what is going on. Sales are instant. Analyze Performance.
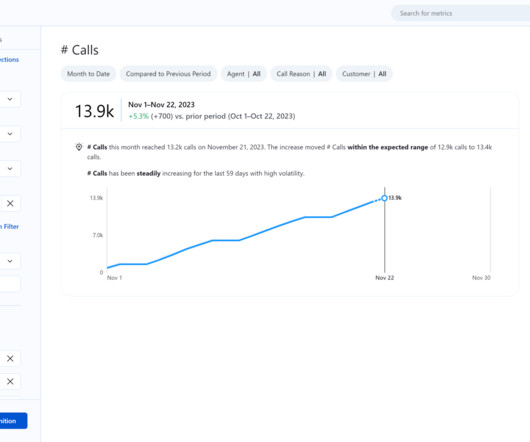
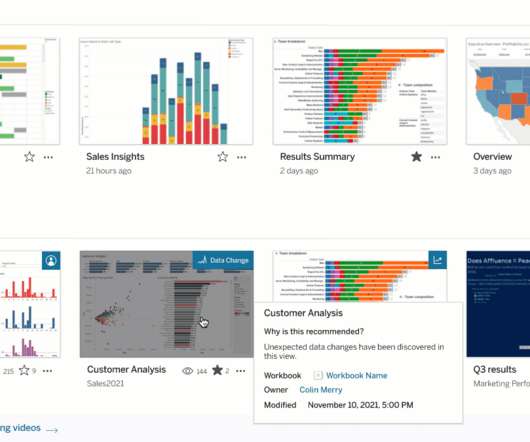
You might have dozens, if not hundreds, of relevant metrics that help you keep a pulse on your business. But with an abundance of data comes the paradox of choice; business professionals like yourself do not have the time to check on every single relevant metric. With Data Change Radar, Tableau will do just that.
You might have dozens, if not hundreds, of relevant metrics that help you keep a pulse on your business. But with an abundance of data comes the paradox of choice; business professionals like yourself do not have the time to check on every single relevant metric. With Data Change Radar, Tableau will do just that.
Platforms like GrantPuma—which I founded—partner with Candid to scan tens of thousands of federal and foundation grants, funders’ strategic priorities, and funding trends to deliver relevant opportunities. What about data privacy concerns? With the increasing use of AI, data privacy concerns are natural and warranted.
We organize all of the trending information in your field so you don't have to. Join 12,000+ users and stay up to date on the latest articles your peers are reading.
You know about us, now we want to get to know you!
Let's personalize your content
Let's get even more personalized
We recognize your account from another site in our network, please click 'Send Email' below to continue with verifying your account and setting a password.


Let's personalize your content