This site uses cookies to improve your experience. To help us insure we adhere to various privacy regulations, please select your country/region of residence. If you do not select a country, we will assume you are from the United States. Select your Cookie Settings or view our Privacy Policy and Terms of Use.
Cookie Settings
Cookies and similar technologies are used on this website for proper function of the website, for tracking performance analytics and for marketing purposes. We and some of our third-party providers may use cookie data for various purposes. Please review the cookie settings below and choose your preference.
Used for the proper function of the website
Used for monitoring website traffic and interactions
Cookie Settings
Cookies and similar technologies are used on this website for proper function of the website, for tracking performance analytics and for marketing purposes. We and some of our third-party providers may use cookie data for various purposes. Please review the cookie settings below and choose your preference.
Strictly Necessary: Used for the proper function of the website
Performance/Analytics: Used for monitoring website traffic and interactions
and provided the two possible responses of “friends&# or “data&# – I used the question style where respondents had to pick one answer or the other exclusively. And once all 100 responses were gathered, I took a look at all the data. First, overall: And when you click on “What does this chart mean?&#
I wrote a blog post called, Mashups, Open APIs, and the Future of Collaboration in the Nonprofit Tech Sector. The updates introduce Semantic Analysis and Natural Language Processing (NLP) capabilities to the Social Actions API and begin to connect Social Actions to the wider Linked Open Data community. I was surprised to the say least.
Open Data November 8, 2007 As the hype (which, I agree I have contributed to ) around OpenSocial dies down, the reality behind OpenSocial becomes clear. Tim O’Reilly has a bang-on post about the fact that OpenSocial does not mean that users can have data portability. O’Reilly doesn’t really have an answer for that one.
Via Britt Bravo Do you have an idea for how a mashup could be a tool for social change? Can you imagine a way to combine data that would increase awareness around an issue? You don't need to have tech expertise to submit a project to the Challenge, just an idea for a change you want to make that could be facilitated by a mashup.
This is a graph of aggregate data from Jawbone,a wristband that people wear that tracks their steps throughout the day and their sleep patterns during the night. (h/t h/t Robert Scoble ) This aggregate data shows exactly when and how many people in the San Francisco were bolted awake by the recent Napa Valley earthquake.
Mashups are great. But I think 2009 will see a more refined world of mashups take over. We have seen plenty of mashups where a website is able to push together a mapping tool, some public data, and user-created content like comments. Mashups of applications and spaces, not just information. I love them!
For four weeks this summer, we got a crash course in data transparency. Entrants built useful applications incorporating at least one data feed from Data.gov , in an effort to make government data accessible and usable. Everyone on the team -- and at Forum One -- is committed to data transparency. Enhances your mission.
The call to build a data-driven organization is as loud as ever. But how do you do so in a, well, data-driven way? What actions should you prioritize to scale the use of data and build a Data Culture? Use the Tableau Blueprint Assessment to measure, plan, and build a data-driven organization. . Kristin Adderson.
We're hosting a contest called the NetSquared Mashup Challenge that I wanted to let you know about, and am hoping that you'll pass on to social changemakers and web innovators in your community. Wikipedia defines a mashup as, "a web application that combines data from more than one source into a single integrated tool."
We're seeing exciting trends in governments making data more available ? Whether on crime, education, or the environment, governments are putting more data on the web. And they're doing it in ways that allow people to build web applications on top of the data. But local and state governments are also setting their data free.
Anyway, there is a terrific video interview of Marshall and text transcript over at Master New Media where Marshall talks about Mashups. I've been researching widgets recently and the last section of the interview covers that: Marshall Kirkpatrick : I???ve ve been thinking about widgets, relative to mash ups, lately. RG: What???s
What visual representations of geographic data can help tell your organization's or cause's story? When you click on a place-mark on Gharbia's Google Maps mashup, a pop-up reveals details, stories and videos of prisoners and their families. What are some ways that this could be used to enhance a nonprofit's program delivery?
People who can touch API's out there have been fooling around with trying to extract data from the NpTech tag for analysis as well as think about ways that we can make the data that has been tagged more filtered via social search, collaborative filtering, and whatever else. Deborah Finn's thoughts on the NpTech Tag Mashup.
I remember leaving for Vegas and making a promise to Joe that I would submit a mashup to the 2009 Change the Web Challenge. The mashup was a map showing where people were volunteering in near-real-time. ″, that focuses on open standards and linking data. It ended up winning the competition, $5,000 and lots of exposure.
The vulnerabilities relate to how Wi-Fi handles large chunks of data, with some being related to the Wi-Fi standard itself, and some being related to how it’s implemented by device manufacturers. One exploits routers accepting plaintext during handshakes, one exploits routers caching data in certain types of networks, etc.
Peter Deitz is a long-time member and contributor in the NetSquared (and TechSoup) community; he started the NetSquared Montreal group and his Social Actions project was a winner in the 2008 N2Y3 Mashup Challenge. To learn more about it, I caught up with Peter earlier this week to get all the details and am excited to share them here first!
There were people already doing cool stuff, like InSTEDD and some great work around mashups of humanitarian data in Afghanistan, as well as folks discussing lauching cool new social enterprises (but we can't talk about them yet). One sample session was the one on the Google Book Settlement, led by Pam Samuelson of UC Berkeley.
Instead, consider the below to be a data point on which startups made us do a double take, be it due to the size of the market opportunity, the ambition exhibited by the founding team or an idea that was just too clever to pass up. Genei is, dare I say, a refreshing mashup between robots and writers.
Over the past 10 years, the mashup of the web and our personally identifiable data (PID) has grown up. Data silos also create problems. Whether it’s data or dances, silos keep people separated at the party. An organization that owns its data and manages it correctly owns its distribution channels.
I gave a keynote about the Human Side of Data for Good and facilitated a mini-innovation lab to brainstorm creative ideas around the challenge of communicating about the value of shared data and becoming the community knowledge center for shared data for donors, nonprofits, and other stakeholders. Photo by Rachel Calderon.
Like the freedom that RSS gives to end users in terms of getting the data that you want in your hands, to read when and how you want it, APIs give programmers (and, at times, end users) the freedom to get data from Web 2.0 One of the best examples of the use of APIs are Google Map mashups.
The data- and AI-focused company has secured a $1.6 The company, which makes open source and commercial products for processing structured and unstructured data in one location, views its market as a new technology category. Databricks calls the technology a data “lakehouse,” a mashup of data lake and data warehouse.
For the Data Leadership Collaborative Braindates, I hosted a session on Imposter Syndrome. What happens next in the scene is how I sometimes feel—me saying to the universe, “Just give me a sign that I know what I’m doing in this world of data. Kristine Wiesner , The Data School UK. Data Culture, Blueprint. July 2, 2022.
For the Data Leadership Collaborative Braindates, I hosted a session on Imposter Syndrome. What happens next in the scene is how I sometimes feel—me saying to the universe, “Just give me a sign that I know what I’m doing in this world of data. Kristine Wiesner , The Data School UK. Data Culture, Blueprint. July 2, 2022.
In a 2018 report , Gartner predicted that 85% of AI projects will deliver erroneous outcomes due to bias in data, algorithms or the teams responsible for managing them. Assuming Choi’s estimations are rooted in fact, Bobidi bucks the trend in the data science industry, which tends to pay data validators and labelers poorly.
The call to build a data-driven organization is as loud as ever. But how do you do so in a, well, data-driven way? What actions should you prioritize to scale the use of data and build a Data Culture? Use the Tableau Blueprint Assessment to measure, plan, and build a data-driven organization. Kristin Adderson.
In addition, the Museum has taken those tips and created a mashup with the YELP api. Integrate with Foursquare by pulling their data into your primary database of record – building an even more holistic view of your constituents by adding the location and preference data from Foursquare. Track volunteering efforts.
New open source players entering the market (more on them soon), high satisfaction for other open source tools, and SaaS vendors throwing the doors open so that nonprofits can integrate their systems well (I’m psyched to hear about all the new connectors, mashups and apps happening all the time.)
Datamasher.org provides the public with a simple interface to mash up government datasets to analyze and visualize the data in innovative ways. Datamasher allows you to take two different public data sources and mash them up with an operator (+ - * /). Then you can share them with your friends and comment on the mashups of others.
Only the basic, free level is launching today, and that has limits on how many API calls developers can make (aka how frequently their software can ping Twitter for data). Twitter also offers an incredibly rich source of data for academics studying large-scale social trends.
Carr reports that some hard data is coming out this week on the adoption of Web 2.0 While it didn't include tagging, it did include mashups; the other five were the same. via Nicholas Carr's Rough Type Blog. tools by companies: Forrester released some results from a December 2006 survey of 119 CIOs at mid-size and larger companies.
I wanted to use today to focus in on a question recently posed by my good friend Joe Solomon on Twitter : What are the nonprofit/orgs that are working 2 wire the green movement, like what @ netsquared does 4 nonprofits, @ sunfoundation for politics; which orgs are working to expose data, leverage soc media, connect the orgs together?
We hope that this will spur development for more social applications and mashups as well as better distribution of these applications worldwide. Katrin over at MobileActive.org weighs in , and I agree: So what does this mean for the ‘mobile for good’ field?
He or she has created one of the most innovative, enjoyable mashups out of a cultural icon. What's a mashup? speak, it's a web application that combines data from more than one source to create a new tool. This mashup turns a simple list of quotes into a geographically browsable conversation.
For our work today, it’s any startup that either delivers its main value proposition via an API — Twilio, say — or is built to use APIs to facilitate a particular data transference — AgentSync, etc. But without that many public firms, we have to lean on private-market data. What’s GGV built?
A wealth of data sources are becoming available online, allowing data from around the world to be mingled, mixed, and mashed up -- and where data does not yet exist, communities are using these new tools to gather it themselves! Collecting and Disseminating Information - Ushahidi. monitor election results in Mexico and India.
Here's the lowdown: Apps for America will award developers for the best applications, based on data from Sunlight and its partners, that make Congress more accountable, interactive, and transparent. > " Duh: the NTEN community! > Learn more about the contest at [link]. The grand prize is $15,000.
When participants collected data, they learned a great deal about data collection processes but not so much about the overall scientific method. In contributory projects, participants collect data in a scientist-controlled process. Scientists design the test questions, steer the data collection, and analyze the results.
It would be mobile compatible with data in/out abilities. This same platform would have a series of APIs, so that doctors offices, schools, universities, researchers, community groups, local businesses and anyone with an interest could build applications, mashups and widgets that could use the data for the long tail of citizen needs. .
The company I work for, TheWebService.com&# , has created a new form of data storage, called “MyTables&# – it’s not open source, and it doesn’t use MySQL, but it is a very convenient and quick way of uploading and managing your own data. Non Profits should never feel that their data is being held hostage.
There were two different kinds of APIs discussed – the ones that help organizations with interoperability within their organizational systems – getting data from one app to another, and using APIs for things like Google maps mashups. It seemed that only Blackbaud had APIs you have to pay for. That’s good news.
Data from this year’s Benchmarks made it clear that TikTok is being used by many nonprofits—30% of Benchmarks participants were active on the platform in 2022. While trending sounds change often, Taylor Swift’s songs and mashups have remained some of the most popular sounds in recent months.
Ordnance Survey lets people do mashups with its maps | Technology | Guardian Unlimited: "Normally we keep stuff about the Free Our Data campaign to its own blog, but some things are worth mentioning here too. This ties in with our story in today's Technology.
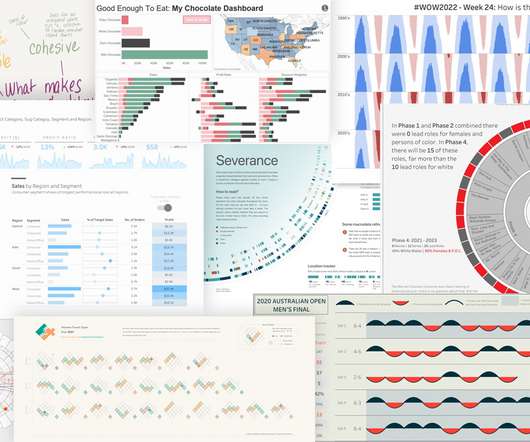
While the practice of using images to convey meaning is nothing new to humans, dating back to the earliest cave drawings, putting data into visual representations seems to have taken on a new life in this day and age where mashups are king on the internet. Below are some links to a great collection of data visualizations.
We organize all of the trending information in your field so you don't have to. Join 12,000+ users and stay up to date on the latest articles your peers are reading.
You know about us, now we want to get to know you!
Let's personalize your content
Let's get even more personalized
We recognize your account from another site in our network, please click 'Send Email' below to continue with verifying your account and setting a password.


Let's personalize your content