This site uses cookies to improve your experience. To help us insure we adhere to various privacy regulations, please select your country/region of residence. If you do not select a country, we will assume you are from the United States. Select your Cookie Settings or view our Privacy Policy and Terms of Use.
Cookie Settings
Cookies and similar technologies are used on this website for proper function of the website, for tracking performance analytics and for marketing purposes. We and some of our third-party providers may use cookie data for various purposes. Please review the cookie settings below and choose your preference.
Used for the proper function of the website
Used for monitoring website traffic and interactions
Cookie Settings
Cookies and similar technologies are used on this website for proper function of the website, for tracking performance analytics and for marketing purposes. We and some of our third-party providers may use cookie data for various purposes. Please review the cookie settings below and choose your preference.
Strictly Necessary: Used for the proper function of the website
Performance/Analytics: Used for monitoring website traffic and interactions
Finance teams can help their nonprofit organizations evaluate new revenue streams, enhancing the organizations stability and mitigating risk while intentionally experimenting with varied income sources. Verify Feasibility Once you confirm that the opportunity aligns with your mission, evaluate the feasibility of launching it.
You could also use this opportunity to gather participant insights through surveys or feedback forms. Analyze Data: Use Google Analytics or a QR code analytics tracking platform (many QR code generators offer this) to track scans and measure campaign success. Evaluate which materials generate the most engagement.
Steps to Assess Current Capabilities: Evaluate Digital Readiness: Review your digital tools, infrastructure, and staff skills to identify areas for improvement. Analyze Member Engagement: Use surveys or focus groups to assess how well youre meeting member needs and expectations. Ready to take the first step?
Our 2024 Digital Trends Survey reveals that organizations that integrate these elements are better positioned to navigate uncertainty and seize opportunities in an era of transformation. Yet, our survey shows that many organizations lack a formalized approach to tackle todays challenges and prepare for tomorrow.
How to Leverage LMS Data Analytics for Better Decision-Making in Corporate Training GyrusAim LMS GyrusAim LMS - In today’s competitive business landscape, Learning and Development (L&D) programs are key drivers of employee growth, retention, and overall business success. billion in 2020–21.
Also, create surveys to hear directly from grantees about what is working and where there are unnecessary hurdles. Two Ten is using a survey to evaluate their processes and remove barriers so they are continually improving their grantee experience. Always assume that there is a better way to collect data or administer grants.
This comprehensive exploration of your digital systems could include evaluating security, network functions, system management, user experience, and overall performance. An evaluation of current security practices and systems can pay big dividends. But failure to use data effectively can also be dangerous.
Using data in your content strategy will help you identify what content members value most, what isn’t resonating and what needs to be tweaked. Here are some tips for using data to create relevant content for your members and customers. Here are some tips for using data to create relevant content for your members and customers.
New data shows 4.6% The data is from the report Give.org Donor Trust Report 2024: Trust and Giving Attitudes Across U.S. More than 2,200 adults in the United States (and a separate section with more than 1,000 adults in Canada), were surveyed for insight on how people with self-reported religious affiliation – from different U.S.
A spontaneous cruise of the office was an effective strategy for evaluating a variety of business indicators. The desire to be fully aware of the strengths and weaknesses of your team drives this type of evaluation. Evaluate Resources IT deficits equal a rocky road for remote work. Remember Management by Walking Around?
Volunteer engagement surveys are an invaluable tool for nonprofits. Explore how these surveys can provide crucial insights, elevate the experience for volunteers, and optimize processes, to help nonprofits better achieve their mission. Conducting a satisfaction survey can help a nonprofit identify areas where improvements can be made.
Even with a friendly name like “feedback, check-in, or coaching,” a performance evaluation can be uncomfortable, or possibly downright scary. That’s probably why more organizations don’t have a process for evaluating the board of directors, or if they do, that assessment is not continuous. I’ll get on my Association 4.0
While serving on the organization’s board for seven years, I saw how the collection and analysis of constituent data helped SAGE identify needs, enhance its programs to meet those needs equitably, and advance its mission. Analyzing data to ensure program impact and effectiveness With an annual budget of $21.8
The analytics tools will also evaluate your posts to deduce the best possible times to share your content. SurveyMonkey is an online survey service ideal for gathering feedback from donors and supporters. For multilingual surveys, see Alchemer. Open Data Project :: nptechforgood.com/open-data-project.
According to a Workday global survey, three out of four employees say their organization is not collaborating on AI regulation and the same share says their company has yet to provide guidelines on responsible AI use. But many of us also have concerns about how AI is being incorporated into our fields.
Understand the Needs of Your Staff Whether you create a working committee or find ways to survey your staff, make sure your policy reflects the needs of your staff and isn’t simply a directive from leadership. For example, no one should use proprietary, sensitive, or personal data as defined by your classification policy in the prompts.
Candids Issue Lab is an open-access library dedicated to collecting, preserving, and sharing reports, case studies, surveys, and toolkits published by social sector organizations. Data Science, AI and Data Philanthropy in Foundations: On the Path to Maturity by Philea and Fondazione Compagnia di San Paolo. Kellogg Foundation.
John Story is general counsel and chief data ethics officer at Acoustic. Did you know your company’s data privacy practices can be a competitive differentiator? But winning the trust of consumers often goes hand-in-hand with winning their business: 87% of surveyed U.S. Assess how customers want their data treated.
Today, Candid released our latest research manual, Analyzing Candid’s demographic data. nonprofits currently share some demographic data about their staff and board with Candid. In fact, about 1,000 nonprofits are now adding demographic data to their Candid profiles every month. Over 62,000 U.S. For example, U.S.
How Math is the Solution Since 2019, CollegeAPP has surveyed Americans nationwide to identify adults who intend to pursue postsecondary education and training. Key Findings from Our Surveys Below are some additional findings from our work.
Essentially, this is a folder of Word documents each containing answers to common grant application questions, like organization mission and activities, the greatest challenges our nonprofit faces, how we measure and evaluate program impact, how we recognize funders, etc.
Data Quality Chronicles Missing data, missing mechanisms, and missing data profiling Missing Data prevents data scientists to see the entire story the data has to tell. One of them was, unsurprisingly, Missing Data. Photo by Ronan Furuta on Unsplash. Image by Author. Let’s consider an example.
Measurable training metrics may include completion rates, engagement rates, course evaluations, and assessment scores. This can be measured through methods such as surveys. Analyzing Data with Learning Analytics Tools With GyrusAim LMS, data can be analyzed and interpreted with robust analytics features.
For example, you could survey lapsed donors to ask why they stopped donating. Evaluate if these metrics change when you adjust your email frequency. Prioritize tracking the following data points: Average email open rate: The frequency at which recipients open your email messages. Average email open rates are 15-25%.
To better understand what caused this, we included DEI-related questions in exit interviews and staff surveys, analyzing the data by identity group to spot trends. pay structure and created an adaptable approach for our regional offices where reliable living wage data wasn’t available.
To help you compile this survey and get the data you need, we’ve compiled a few tips for writing post-event surveys and details of some of the most important questions that you need to ask. Here’s what you need to know about post virtual event surveys: Tips for Crafting Your Post Virtual Event Survey.
What software will your team use to streamline all the information, donations, and data you will be collecting? Evaluate the success of your nonprofit’s event and make required changes to improve year over year. Survey Your Donors and Past Participants For What They Want to See. Will you be selling tickets to the event?
“We thought, if they use a paper feedback form, it actually creates a lot of hassle, like entering all the data into an Excel spreadsheet,” he told TechCrunch. How’s the restaurant owner going to get actionable feedback based on data in an Excel spreadsheet?”. The hidden cost of food delivery.
Browsing travel options on Google Flights, you may have noticed that airlines have begun to incorporate carbon emissions data into their offerings to consumers. It’s exciting to have a new data point to understand my personal carbon footprint, but it also highlights a real inflection point for the investor community.
We’re living in an era of technological advancements, AI, and data-driven fundraising solutions that can take your nonprofit organization to the next level. Preparing for Fundraising Before diving into fundraising, take a moment to evaluate your programs and services. If you’re ready to move beyond grants, let’s get started!
Here’s the good news: with preparation and a pulse on the right data and information, it is possible to get a handle on the task and get a big picture of your organization’s needs. Prior to embarking on a redesign or a site build, you’ll need a baseline of data to have a grasp on how your current site is doing. About the Author.
The war has severely limited access to data about Ukraines natural resources. However, as a geoscientist with experience in resource evaluation, I have been reading technical reports, many of them behind paywalls, to understand whats at stake. Geological Survey, shows that more than a dozen relied upon by the U.S. Why the U.S.
Since 2014, Candid has been collecting demographic data about the people who work at U.S. To date, over 54,000 organizations have shared some data about how their staff and/or board identify by race/ethnicity, gender, sexual orientation, and/or disability status. Demographic data sharing varies by nonprofit subject category.
You can do this by implementing mid-course check-ins or post-course evaluations. This data-driven approach ensures that learners receive the best possible educational experience, with high-quality instructors driving engagement and knowledge retention.
There are technology tools that can make information and data analytics accessible to everyone. Data management platforms are constantly improving their user-friendliness, flexibility, and reporting capacity. Promote data sharing across the organization, and reward people for effectively using new analytic tools.
While the 2020 shift to virtual events may have been challenging, event planners quickly discovered loads of useful data that a digital format can provide. But, this data is only useful if you know what to collect and how to analyze it. But, this data is only useful if you know what to collect and how to analyze it.
We have many tremendous employers in the state, so it’s great to see more and more companies take part in this effort to evaluate their workplace cultures and gain the recognition they deserve,” says Indiana Chamber President Kevin Brinegar. These companies consistently demonstrate to their employees how much they value their contributions.”.
According to The Council of Nonprofits 2023 Nonprofit Workforce Survey , almost three quarters of nonprofits that completed the survey have current openings at their organization. Evaluate the tasks the new user will perform regularly before handing over keys to the system.
I am still evaluating the lessons learned. These statistics from ASAE’s Center for Association Leadership’s 2023 State of the Association survey provide compelling reasons for seeking strategic relationships. Evaluate your current community and identify where expanded representation might be beneficial. There are no members.
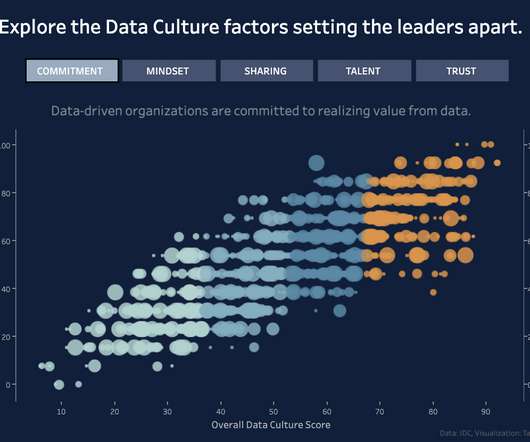
Recent IDC research, sponsored by Tableau, found that 83% of CEOs want a data-driven organization, but only 33% of executives are comfortable questioning business KPIs and metrics1, revealing disparities between what executives “want” and “have.”(1) The five common trends among data-driven organizations are: .
Some organizations approach data quality like a crash diet. Instead, try these 6 steps for sustainable data quality at scale. Photo by Bruno Nascimento on Unsplash I like to think of operationalizing data reliability within the context of physical fitness. There is also a lot of bad data fitness advice.
Then it was all about the data. Next we invested in access to market data from a credible resource — one that we know is used by other companies we respect — with comparable market, industry and size to Plastiq. For Plastiq, the most relevant data centered around what other companies in San Francisco and Boston pay their talent.
Over the last decade, the rate at which organizations create data has accelerated as it becomes cheaper to store, access, and process data. But as data continues to grow in scale and complexity, it’s becoming scattered across apps and platforms — often leading to problems where it concerns data quality.
Indeed, Waymo, which was spun out of Google in 2016, mostly communicates about its self-driving program through glossy press releases or blog posts that reveal scant data about the actual nuts and bolts of autonomous driving. But in this paper, and another also published today, the company is showing its work.
We organize all of the trending information in your field so you don't have to. Join 12,000+ users and stay up to date on the latest articles your peers are reading.
You know about us, now we want to get to know you!
Let's personalize your content
Let's get even more personalized
We recognize your account from another site in our network, please click 'Send Email' below to continue with verifying your account and setting a password.


Let's personalize your content