This site uses cookies to improve your experience. To help us insure we adhere to various privacy regulations, please select your country/region of residence. If you do not select a country, we will assume you are from the United States. Select your Cookie Settings or view our Privacy Policy and Terms of Use.
Cookie Settings
Cookies and similar technologies are used on this website for proper function of the website, for tracking performance analytics and for marketing purposes. We and some of our third-party providers may use cookie data for various purposes. Please review the cookie settings below and choose your preference.
Used for the proper function of the website
Used for monitoring website traffic and interactions
Cookie Settings
Cookies and similar technologies are used on this website for proper function of the website, for tracking performance analytics and for marketing purposes. We and some of our third-party providers may use cookie data for various purposes. Please review the cookie settings below and choose your preference.
Strictly Necessary: Used for the proper function of the website
Performance/Analytics: Used for monitoring website traffic and interactions
Beth’s blog shares Ann Emry’s tips for creating charts with your nonprofit’s data. Charts can turn plain text into a visually, expressive piece of information, which is great for persuading donors to donate or showing your supporters your organization’s impact. Chart diversity. Visual communication.
But being a nonprofit data is not just about being an Excel ninja, it is also about visualizing data and being a chart master. When Ann told me she has lots of secrets and time saving tips for charts and offered to write this guest post, I was thrilled. Charts can be one of your strongest communication tools. Secret #10.
“Socialnetworks will be like air.&#. 3 things need to make socialnetworks like air: Identity - who are you? pick your friends once - socialnetworking fatigue. calendar, call, sms, facebook, twitter, address book = level of closeness of social data. Evaluate where social makes sense.
Another NTC means more great studies about nonprofit technology released, including the 2012 " Nonprofit SocialNetworking Benchmarks Report." for yourself: > Download the 2012 Nonprofit SocialNetwork Benchmark Report. It's free! >
Creative Commons on Flickr : A great source for images for your organization’s website, blog, e-newsletter, socialnetworking profiles, etc. budget, taxes, and spending: Income Tax Chart , Cost Of War.com and budget charts. oneforty : A gallery of over 2,500 (and counting) Twitter Apps.
That’s the bet behind IRL, a young socialnetwork that has been quietly growing over the past year and just attracted an eye-popping amount of money to take on Facebook. According to Shafi, the goal is to become “a super messaging socialnetwork” over time. “We Image: IRL.
I've been in Washington, DC for the Network Effectiveness and Social Media Strategy Map working session for Packard Foundation Grantees convened by Monitor Institute. This is a post to help me identify what I don't know about socialnetwork analysis and mapping tools with the hope that you'll fill in the gaps in the comments.
All Blackbaud Blogs Contact Us Blackbaud.com About Nonprofit Trends Books Research Reports Speaking It’s the Seating Chart, Stupid Posted by Steve MacLaughlin on November 18th, 2010 Where should the Internet team be on the organization chart? Focus on the seating chart. Who should own the Internet at our nonprofit?
The Millennial Donor report uncovered that celebrity is the bottom of the charts: When asked to describe what motivates them to give, 85% of Millennials pointed to a compelling mission or cause, and 56% cited a personal connection or trust in the leadership of the organization. But, on the top of the chart: a compelling cause.
Note from Beth: As visiting scholar at the Packard Foundation, I'm connecting with other people who are studying and learning about how networks work. A lot of the ideas resonate with using online socialnetworks and social media effectively for nonprofits, especially in the larger frame of movement building.
The SPAC parade continues in this shortened week with news that community socialnetwork Nextdoor will go public via a blank-check company. Our usual mockery of SPAC charts mostly doesn’t apply. socialnetworks (Facebook, Snap, Instagram). The unicorn will merge with Khosla Ventures Acquisition Co.
In fact, their Web Posting Response Assement flow chart can serve as a strong models to guide your staff in best practices of online conversation.( Tags: nptech Best practices online community Blogging Socialnetworking Non-profit Communications social media diagram. read more ).
Creators frequently branch out onto other socialnetworks and into more traditional media formats once they’ve found success on one platform. Dixie, Charli’s sister, released a debut single in June that quickly jumped onto Billboard ’s Emerging Artists chart. (To
Xiaohongshu continues to hold the top spot on the US App Store’s free socialnetworking apps chart. Its noticeable that the name appears entirely in lowercase, instead of the previously used RedNote commonly seen in translations. IThome , in Chinese]
Daniel Liss is the founder and CEO of Dispo , the digital disposable camera socialnetwork. District Court for the District of Columbia put it in his recent decision , “No one who hears the title of the 2010 film ‘The SocialNetwork’ wonders which company it is about.” Daniel Liss. Contributor. Share on Twitter.
Time Chart - See Flickr Discussion on Version 1 Wanna Remix it? I'd also include your individual socialnetworking profile which can be a great way to spread buzz (or spread yourself too thin.) (10-15 Once you have content created through these methods, it can be easily shared using the buzz tools above through socialnetworks.
In my levels of engagement chart, a simple action involves befriending (e.g. Now there's one slight problem for us online campaigners in all of this, and that's how do we move supporters and activists from one point on the chart to the next? MySpace), subscribing, forwarding and/or learning.
A social media following doesn’t guarantee that exclusive pedigree. Although an expert who comes with a big socialnetwork would be at the top of my list. You might even begin your search by following related hashtags on social platforms or industry forums. Influencers are not necessarily thought leaders.
Have you ever wondered if there was a way to gauge and chart your user’s behaviors while they’re on your WordPress website? One of the most popular available currently is Crazy Egg, a tool that allows users to create heatmaps that chart very specific elements of user interaction. Here are a handful worth investigating and implementing.
A new social app, Locket , popped to the top of the App Store charts in recent days thanks to its clever premise to put live photos from friends in a widget on your iOS homescreen. 1 SocialNetworking app the day prior. Locket, he admits, was originally a personal side project — not his main focus.
." Facebook Reporting Guide Shows How Site Is Policed (INFOGRAPHIC) – "Facebook Inc offered a rare peek on Tuesday at one facet of the elaborate system it uses to police its 900 million-user socialnetwork, as it attempts to keep it free of content it deems offensive, illegal or just plain inappropriate.
Second, the majority of nonprofits have not raised a dime on social media. According to the Nonprofit SocialNetworking Benchmark Report by Blackbaud, only 2% of nonprofits raised between $10K and $25K on Facebook in a 12 month time period. Take a look at the chart below. Social media is definitely not free.
I first came across their thinking and work on building socialnetworks for social change via the resources section on the Barr Foundation web site back in 2006. Peter Plastrik and Madeleine Taylor co-wrote " Net Gains ," one of the first practical handbooks on building and working in networks for social change.
Though the socialnetworking behemoth continues creeping toward 700 million global users, six million Americans quit the site in the month of May. That's the first time Facebook has lost U.S. This is well and good for the information-consuming public; however, these results can spawn curiosities that are fun to dig into.
In this week’s episode of “should the socialnetwork leave it up or take it down?” Illustration by James Bareham / The Verge. we have Facebook wading into another thorny moderation situation, this time in Thailand. But the company’s response is not all too surprising.
Note from Beth: As visiting scholar at the Packard Foundation, I'm connecting with other people who are studying and learning about how networks work. A lot of the ideas resonate with using online socialnetworks and social media effectively for nonprofits, especially in the larger frame of movement building.
I’m talking about the stuff we consume daily to keep inform of our professional field. It comes speeding at us from our email boxes, socialnetworks, kindles, and even paper and snail mail! We scan, we browse, we try to thoughtfully read the best stuff, and interact through online conversations.
We were interested in: How much and how often donor s gave How many donors were gained and lost Where donors were in the long-term donor lifecycle How donors behaved in different online venues: socialnetworks, giving portals, and charity websites. so you look good on your portal and socialnetworking listings.
Smith and his talk "Charting Collections of Connections in Social Media: Creating Maps and Measures with NodeXL." " Marc is with the Connected Action Group , which uses social methodology to gain insights into patterns of communities. What is socialnetwork analysis?
Org charts, like maps, aren't given the attention they should be, especially in large institutions. Org charts are not just about putting people in their place. They are the basis for a socialnetwork of professionals. But we should have linkable, searchable charts with all of our skills. I was captivated.
Since Tableau's first release in 2004, all visualizations created inside Worksheets have been rendered using VizQL , a breakthrough technology that allows you to create a chart with a simple drag-and-drop. Shipping sankey chart by Tristan Guillevin. Say hello to complex charts, as easy as drag and drop. What are Viz Extensions?
Thursday, August 12, 2010 Go Old School.Use A Flip Chart For Gathering Ideas Heres a great idea from communications consultant, speaker and author David Grossman : And, yes its old school. Grossman recommends that when you have something you want to get your employees input on, post a question on a flip chart in your department or office.
So, for example, if you’re reading your favorite newspaper and see an interesting article you’d like to share with someone – or across a socialnetwork – you just need to scan the paper with the app and it will launch the digital version for sharing. Consider it as a bit like Shazam for print.
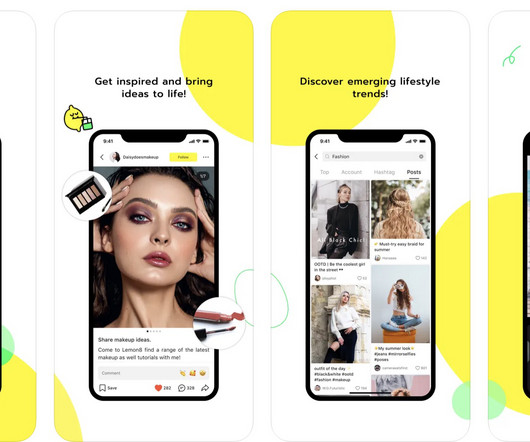
Lemon8, as you may recall, rapidly rose up the App Store charts earlier this year around the same time that U.S. The app, a lifestyle socialnetwork, had originally launched in arch 2020 but was artificially inflated on TikTok this spring. TikTok did not respond to multiple requests for comment on the matter.
frogloop Home frogloop Home Receive monthly updates Subscribe to our RSS feed Follow frogloop on Twitter Most Popular Posts SocialNetwork ROI Calculator SocialNetworking for Nonprofits: ROI, Tracking Tools and More "While Theyre Hot!" So, which one socialnetwork should you consider for your next campaign?
frogloop Home frogloop Home Receive monthly updates Subscribe to our RSS feed Follow frogloop on Twitter Most Popular Posts SocialNetwork ROI Calculator SocialNetworking for Nonprofits: ROI, Tracking Tools and More "While Theyre Hot!" So, which one socialnetwork should you consider for your next campaign?
Yesterday in part one " Measuring the Impact of Your Social Media Program " of this blog series, I discussed the importance of audience reach, how people see your key messages, and how to measure social media reach. None of these measurements will be helpful unless your organization knows how to truly engage people on socialnetworks.
According to research conducted by Social Media Today , pictures are also worth a lot of “Likes” on Facebook too. Take a look at the chart below. Interestingly, answering questions on Facebook are also quite popular, which signals that people still like to be engaged in more social ways and offer their opinions.
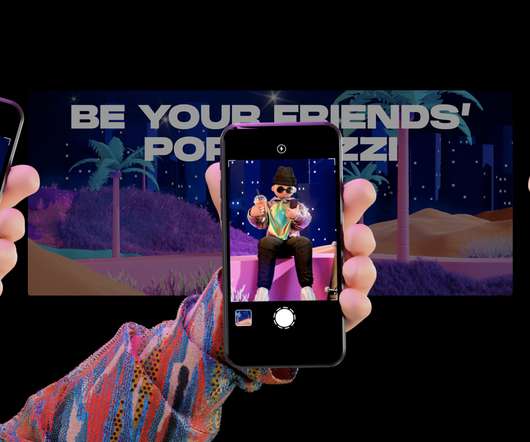
The new socialnetworking app, from the same folks behind TTYL and others, lets you create a social profile that only your friends can post photos to — in other words, making your friends your own ‘paparazzi.’ 1 app on the App Store. poparazziapp comment it! Milkshake – BBY Kodie.
This panel will discuss realistic metrics and benchmarks any organization can use in their campaigns and ensure that your using the right strategies and tools to listen and engage your audiences on different socialnetworks. Over those 80 years, the chart has been polished, refined and so deeply embedded in business thinking.
For example: 32% of infographics use bar charts vs. 22% that use pie charts. If your organization is thinking about making an infographic, definitely check out the “Infographic of Infographics”below, which illustrates the most popular elements incorporated into infographics. 85% use a sans serif font.
frogloop Home frogloop Home Receive monthly updates Subscribe to our RSS feed Follow frogloop on Twitter Most Popular Posts SocialNetwork ROI Calculator SocialNetworking for Nonprofits: ROI, Tracking Tools and More "While Theyre Hot!" link] SocialToo: Creates surveys and tracks social media stats.
A big hat tip to Nedra Weinreich for a link to this study about nonprofit social media adoption: Nora Barnes and Eric Mattson at U Mass Dartmouth surveyed the 200 largest nonprofits and found that they are adopting social media. Makes a lot of sense, given that these tools are mostly free or low-cost, and yet so effective.
I'm still looking for the best places to find numbers on SocialNetworking sites (like number of users and growth -- I'd love a chart or graph of comparisons to MySpace, Facebook, and Linked In. I'd also like to see an age spread that is more recent than the Businessweek chart. I'll try to do a voice over at some point.
We organize all of the trending information in your field so you don't have to. Join 12,000+ users and stay up to date on the latest articles your peers are reading.
You know about us, now we want to get to know you!
Let's personalize your content
Let's get even more personalized
We recognize your account from another site in our network, please click 'Send Email' below to continue with verifying your account and setting a password.


Let's personalize your content