This site uses cookies to improve your experience. To help us insure we adhere to various privacy regulations, please select your country/region of residence. If you do not select a country, we will assume you are from the United States. Select your Cookie Settings or view our Privacy Policy and Terms of Use.
Cookie Settings
Cookies and similar technologies are used on this website for proper function of the website, for tracking performance analytics and for marketing purposes. We and some of our third-party providers may use cookie data for various purposes. Please review the cookie settings below and choose your preference.
Used for the proper function of the website
Used for monitoring website traffic and interactions
Cookie Settings
Cookies and similar technologies are used on this website for proper function of the website, for tracking performance analytics and for marketing purposes. We and some of our third-party providers may use cookie data for various purposes. Please review the cookie settings below and choose your preference.
Strictly Necessary: Used for the proper function of the website
Performance/Analytics: Used for monitoring website traffic and interactions
There are a lot different styles, philosophies, and techniques for facilitating groups of people. Check out the International Association of Facilitator’s Method database which contains more than 500 entries. These skills are useful in all group settings, whether it is a meeting, workshop, or conference. This includes: 1.
If so, here are 5 engaging techniques for recruiting volunteers in the new year. If your organization is struggling to recruit volunteers online, here are 5 engaging techniques you should consider deploying in 2022. The post Recruit Volunteers Online: 5 Engaging Techniques for 2022 appeared first on VolunteerHub. 2022 is here!
Evaluate your content, facilitation, and logistical skills against participant evaluations. Conferences are a great opportunity to take workshops and observe the facilitator’s techniques. Many of us do this and take content notes, but it is also great to take notes about instructional design and facilitation techniques.
I created Excel for Evaluation , a series of more than 25 video tutorials with real examples from nonprofits, to share my favorite techniques with nonprofit leaders like you. Data nerds know how to clean and recode data, look for patterns, calculate key statistics, and then show off the most important information in graphs and charts.
After helping my kids with math homework (they had to represent some data in a chart), I found this awesome, free chart maker at the National Center for Education Statistics. But the bonus was the tutorial to help you better understand and apply charts. Here they are: 1. That’s the most important thing to me, anyway.
This year I’ve been focusing on data visualization and techniques for nonprofits – and working on my visual thinking skills without letting my basic drawing skills become a barrier. I use survey monkey and grab the visual chart for each question and dumping each chart into its own Powerpoint slide.
Senior Data Skills Curriculum Strategy Manager, Tableau. And contrary to popular belief, visualizing data is not intuitive; it must be learned and practiced like any other skill to become proficient. What skills or concepts do you think are most important to cover for students using health and healthcare data? Sue Kraemer.
What we do: Benetech's Human Rights Data Analysis Group (HRDAG) develops database software, data collection strategies, and statistical techniques to measure human rights atrocities. Design and implement data visualizations, including everything from simple static charts and maps to custom interactive visualizations on the web.
Senior Data Skills Curriculum Strategy Manager, Tableau. And contrary to popular belief, visualizing data is not intuitive; it must be learned and practiced like any other skill to become proficient. What skills or concepts do you think are most important to cover for students using health and healthcare data? Sue Kraemer.
Last month I had the pleasure of taking the Luma Institute Train the Trainers workshop where I got a chance to immerse in practicing facilitation techniques based on human centered design principles. The workshop instructor Peter Maher is founder and CEO, of Luma Institute , and a Jedi Master. ” What is Human Centered Design?
So, it is important for us to incorporate techniques in daily work life that reduce the chances of this happening. I can’t possibly read everything, but I am using content curation skills to pick out the best stuff to give more attention to. 3.) Establish Rituals: Rituals in your work life are valuable.
Looking for new techniques to add to your facilitator’s toolbox? This is the focus of a session called “ The Big Bang Theory: Creative Facilitation and Training Techniques, ” that I’m co-facilitating at the Nonprofit Technology Conference with Cindy Leonard and Jeanne Allen. What is Brainstorming? .
Rosario Gauna and Donna Coles both wrote tutorials on the heels of the challenge, detailing how they approached the main requirements: donut charts, bar charts, divergent bar charts, and heatmaps. Process descriptions like this are extremely informative as we develop our own skills.
After all, what better way to test your skills than explaining a technique to others? Charting "Top N and Others" via Table Calculations in Tableau. Drawing Line Charts without Axis Offset in Tableau. Spaghetti Charts Suggested Alternative: A Trellis Chart. Ten Tips & Techniques: Round 5. Nir Smilga.
After all, what better way to test your skills than explaining a technique to others? Charting "Top N and Others" via Table Calculations in Tableau. Drawing Line Charts without Axis Offset in Tableau. Spaghetti Charts Suggested Alternative: A Trellis Chart. Ten Tips & Techniques: Round 5. Nir Smilga.
AIs Emergence and Homogenization In that talk, Liang coined two terms to describe foundation models: Emergence refers to AI features still being discovered, such as the many nascent skills in foundation models. See chart below.) But like transformers, the new technique soon caught fire. The field continues to move fast.
One of the ways to reduce handle this stress, is to flex your emotional intelligence, which includes self-awareness , self-regulation, motivation, empathy, and social skills. Emotional Intelligence is a flexible skill that can be readily acquired and practiced. What is your favorite journaling technique? Do you keep a journal?
My presentation will focus on personal productivity in an age of distraction, tools, skills, and best practices that staff members of nonprofits – large and small need. And, of course, there’s an app to help you apply this skill. We will, of course, share the tools in the context of best practices.
One of the reasons cited in the report and also from participants on the webina: “We don’t have the skills to analyze, slice and dice, and make sense of our data – so we don’t look at it.” The skills are out there. ” I hear this too often from nonprofits. from MIT in rocket science.
One of the topics the peer learning group took a deep dive into was selecting the right chart and techniques offered by nonprofit data nerds Stephanie Evergreen (who write a guest post on how to create great graphs ) and Anne Emery’s tips on how to avoid boring bar charts.
The hot button issue was capacity, skills, and lack of resources. It was articulated as: “We don’t have the skills to analyze, slice and dice, and make sense of our data, so it is hard to do it well.” I hear this too often from nonprofits. The people with skills are out there.
When you want to acquire a new skill or apply some new knowledge, do you learn by passively sitting and listening to an expert lecture for 90 minutes without a break and 150 PPT slides? One technique described that I use often is “share pairs,” it makes people get it up, take that body break, and check in with someone.
You’ll find them talking about topics like Data Culture, Business Intelligence, Data Skills, and more. Being a Tableau Ambassador allows me to help others learn Tableau and empower them with analytics and data visualization skills. Now she makes maps and all the other charts and graphs in Tableau (on a Mac, naturally!)
Rosario Gauna and Donna Coles both wrote tutorials on the heels of the challenge, detailing how they approached the main requirements: donut charts, bar charts, divergent bar charts, and heatmaps. Process descriptions like this are extremely informative as we develop our own skills.
Offer Training in Conflict Management To Social Media Professionals: The book describes techniques for conflict management and how to respond in various situations, but organizing a training for staff that includes role play and simulations to practice these skills is also important.
This shift in working with data—from a job for the few to a skill for everyone—is actively redefining how the world thinks about analytics.”. We also shared more about Tableau Business Science , a new category of analytics that makes sophisticated data science techniques more accessible for business people.
It does close-ended questions and displays a bar chart or can also create a word cloud. Help the participants narrow down topics to discuss or work in small group exercises (replaces sticky dot voting and visualize the vote technique). see above) It is designed to be used in face-to-face workshops and conferences.
Truly effective leaders are also distinguished by a high degree of emotional intelligence, which includes self-awareness , self-regulation, motivation, empathy, and social skills. Emotional Intelligence is a flexible skill that can be readily acquired and practiced. Self-Management Skills. Inside Out.
In addition to the technical skills and tools described [ in the extended version of this article ], it is also important for staff to incorporate techniques into their daily work life that reduce distraction and stress. I've charted those – so I know when they occur). Have any techniques to add to this list?
But if you want to get better results, you need a content strategy, strong creation and curation skills, and a robust measurement process. One technique I use to get insights from my social media data is to do an analytics Rorschach Test.
Thursday, August 12, 2010 Go Old School.Use A Flip Chart For Gathering Ideas Heres a great idea from communications consultant, speaker and author David Grossman : And, yes its old school. Grossman recommends that when you have something you want to get your employees input on, post a question on a flip chart in your department or office.
This shift in working with data—from a job for the few to a skill for everyone—is actively redefining how the world thinks about analytics.”. We also shared more about Tableau Business Science , a new category of analytics that makes sophisticated data science techniques more accessible for business people.
I want to shout out to all the Community members providing content and blogs to the Tableau Community in multiple languages and making data skills more accessible across the world. Ten Table Tips & Techniques - Round 4. Calculate the AREA of your polygons in Tableau and then create charts to compare the sizes. Nir Smilga.
Are there facilitation skills/techniques that you enjoy and are great at doing? Are there facilitation skills/techniques that you want to improve or work on? This can be done with a flip chart and markers or there might be one graphic facilitator dedicated to this task. Do you have a preferred method?
I want to shout out to all the Community members providing content and blogs to the Tableau Community in multiple languages and making data skills more accessible across the world. Ten Table Tips & Techniques - Round 4. Calculate the AREA of your polygons in Tableau and then create charts to compare the sizes. Nir Smilga.
We designed a highly interactive workshop based on Jo Wolfe’s “ NGO Digital Maturity Matrix ,” an assessment tool that enables nonprofits to codify mindsets and skill sets required for moving along the path of digital transformation. Others have also documented and used the technique or taught others how to do it.
I had a chance to listen in on other trainings, which included some techniques for creating a recruitment culture - where chapters can reach out to new members and draw them in - face-to-face networking. The techniques of face-to-face networking strategies are very much transferable to online tools. I feel really inspired!
If you’re looking for a fun way to connect with data enthusiasts while also reinforcing foundational data visualization skills, Back to Viz Basics (B2VB)—a Tableau Community Project—is the perfect place to start. Participants learn, practice, and apply their data skills across a variety of topics, products, and causes.
If you’re looking for a fun way to connect with data enthusiasts while also reinforcing foundational data visualization skills, Back to Viz Basics (B2VB)—a Tableau Community Project—is the perfect place to start. Participants learn, practice, and apply their data skills across a variety of topics, products, and causes.
If you’re looking for a fun way to connect with data enthusiasts while also reinforcing foundational data visualization skills, Back to Viz Basics (B2VB)—a Tableau Community Project—is the perfect place to start. Participants learn, practice, and apply their data skills across a variety of topics, products, and causes.
Since Tableau's first release in 2004, all visualizations created inside Worksheets have been rendered using VizQL , a breakthrough technology that allows you to create a chart with a simple drag-and-drop. Shipping sankey chart by Tristan Guillevin. Say hello to complex charts, as easy as drag and drop. What are Viz Extensions?
Data Skills Program Manager, Tableau We’ve all been there: You’re talking with a friend, watching the news, or sitting in a meeting and the conversation turns to data. If I was trying to figure out what was causing a problem, I’d use the 5 whys technique developed by Toyota Motors founder Sakichi Toyoda.
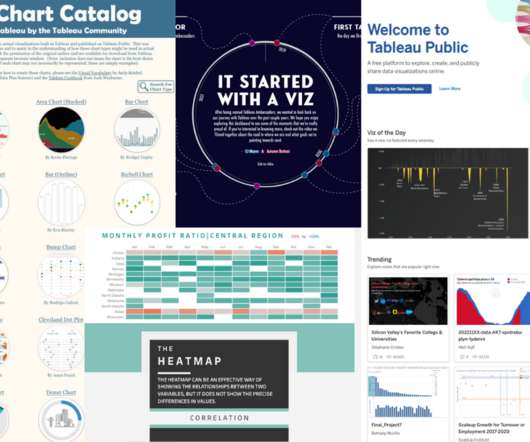
Collage of Tableau Public visualizations ( The Tableau Chart Catalog by Kevin Flerlage, The Tableau Chart Builder by Jeff Plattner, and It Started With A Viz | VOTD by Autumn Battani) and the Tableau Public homepage. Create custom maps, charts, and graphs in clicks. Taha Ebrahimi. Director, Tableau Public. Ateken Abla.
Collage of Tableau Public visualizations ( The Tableau Chart Catalog by Kevin Flerlage, The Tableau Chart Builder by Jeff Plattner, and It Started With A Viz | VOTD by Autumn Battani) and the Tableau Public homepage. Create custom maps, charts, and graphs in clicks. Taha Ebrahimi. Director, Tableau Public. Ateken Abla.
We organize all of the trending information in your field so you don't have to. Join 12,000+ users and stay up to date on the latest articles your peers are reading.
You know about us, now we want to get to know you!
Let's personalize your content
Let's get even more personalized
We recognize your account from another site in our network, please click 'Send Email' below to continue with verifying your account and setting a password.


Let's personalize your content