This site uses cookies to improve your experience. To help us insure we adhere to various privacy regulations, please select your country/region of residence. If you do not select a country, we will assume you are from the United States. Select your Cookie Settings or view our Privacy Policy and Terms of Use.
Cookie Settings
Cookies and similar technologies are used on this website for proper function of the website, for tracking performance analytics and for marketing purposes. We and some of our third-party providers may use cookie data for various purposes. Please review the cookie settings below and choose your preference.
Used for the proper function of the website
Used for monitoring website traffic and interactions
Cookie Settings
Cookies and similar technologies are used on this website for proper function of the website, for tracking performance analytics and for marketing purposes. We and some of our third-party providers may use cookie data for various purposes. Please review the cookie settings below and choose your preference.
Strictly Necessary: Used for the proper function of the website
Performance/Analytics: Used for monitoring website traffic and interactions
What if we made sure the process for identifying SMART objectives included capacity building, measurement, and reflection? What if we stepped away from the process of checking off items on our to do list, and spent a little bit of time charting impact of our nonprofit’s social media use?
Here are six best practices for creating an effective digital impact report that truly reflects your organization’s mission and accomplishments, with a goal of increasing donor engagement. Infographics, charts, and visuals can also help make complex information more digestible and showcase the difference your organization makes.
This can be done with a flip chart and markers or there might be one graphic facilitator dedicated to this task. Overnight Reflection. What I think is the magic is the use of “overnight reflection.” So, being able to “sleep on an idea” and share a reflection is great.
You can check out the Community Voices group on the Social by Social community for videos, notes and other reflections from the event. During these report backs I captured a word cloud on a flip chart of key words. Were you there, and have ideas to add to this reflection? What’s of interest? Existing Communities.
You can check out the Community Voices group on the Social by Social community for videos, notes and other reflections from the event. During these report backs I captured a word cloud on a flip chart of key words. Were you there, and have ideas to add to this reflection? What’s of interest? Existing Communities.
As we prepare to ring in the New Year, we wanted to bring you a taste of our own flavor of Spotify Wrapped by revisiting and reflecting on the top 10 most-read Candid blogs from 2022: 1. Topping the charts of most-read Candid blogs of 2022: the overhead myth.
Nonprofits can do much better by prudently committing the time and effort at the beginning of the year to analyze, reflect, and think collectively on charting how to make best use of finite resources so they can operate most effectively and efficiently over the next 12 months. What are your 2025 fundraising resolutions?
Introducing the Chart of Accounts (COA) Are you ready to nerd out on nonprofit accounting? Introducing the Chart of Accounts (COA) - the foundational accounting tool every nonprofit leader needs to get right for maximum financial insight and awareness. What is a Chart of Accounts? It’s just that important.
What this might look like in your manager is that you are being micromanaged on some days when they are overly worried about how your work reflects on them, and then completely ignored on other days, as they feel overwhelmed by their own workload. Want more advice on helping burned out managers? Here you go: Managers are not okay.
The letterlocking categories and formats chart visualising different ways to organise letterlocking evidence. ” And one of Donnes letters, Smith says, appears to reflect his writing style in its physical engineering, using an unusual and ornate locking mechanism. Image:MIT Libraries, MC0760, UH6203.]
New World had been the number two game on Steam's most-wishlisted chart before its release. That anticipation was reflected a few days after launch when concurrent player numbers hit 913,027, but as Steamcharts' stats show, things have been declining rapidly since then.
This part of the measurement process is most the fun because it covers visualization, pattern recognition, and reflection. I wanted to take a deeper dive into resources out there that provide useful tips about how to do this step for folks who were not data scientists or data nerds. I like the chart advice: Avoid 3d-charts at all costs.
With the end of one year and the start of another, it’s a good time to reflect and renew. Donna Coles reflects on Workout Wednesday using a viz. For some people, the reflections are about endings (and new beginnings). 2021: A Reflection. How to Create a Variation Chart. How to Build a Rank Chart in Tableau?
This week Nvidia confirmed Ghostwire: Tokyo will feature ray traced shadows and reflections along with DLSS with its latest graphics drivers. While the company didn't provide the kind of detailed benchmark chart it has used in the past to explain DLSS performance improvements, Nvidia says the feature can double Ghostwire's.
David Wilcox wrote his reflections on our workshop in Birmingham two weeks ago while stuck on a train enroute back to London. I have been processing my experience and wanted to reflect more on my instructional practice, something I used to do regularly. He's spot on. Once I get in the room, we throw away the slides.
Don’t be afraid of “boring” bar charts. It can be tempting to go a long way and hack Tableau to create non-standard charts with deep visual appeal and a significant “wow” factor. Don’t forget, though, that you have an audience who want to understand your chart. although sometimes elaborate charts impress in other ways.
See the small group exercises timing charts in this document ). The reflection questions might include: What resonated? The first rotation is a quiet reflection alone. Reflection & Takeaways. Participants can be placed into the rooms automatically (randomly) or you can manually assign people to different groups.
1: Make Time Everyday for Reflection: Keep a Journal. The first step is self-awareness and that happens through tracking and observing yourself in work situations that trigger stress. One way to do this is to build in some reflection time into your day and maintain a journal. There are also many other benefits to writing a journal.
I decided to spend a little bit time reflecting on the diagram and pull out some tips for re-learning focus: 1.) Manage Your Attention, Not Just Your Time: Don’t just create a to do list, lay it out on daily and weekly schedule, breaking down key tasks of the project to chunks.
The categories that are represented should reflect qualities that directors bring to the board as well as characteristics that will enhance the organization’s growth and development. An organizational chart. Those achievements reflect your organization’s quality and imply a standard of excellence. Financial statements.
With the end of one year and the start of another, it’s a good time to reflect and renew. Donna Coles reflects on Workout Wednesday using a viz. For some people, the reflections are about endings (and new beginnings). 2021: A Reflection. How to Create a Variation Chart. How to Build a Rank Chart in Tableau?
A chart of accounts (COA) is the foundation for all financial reporting. 3 Steps to Create a Chart of Accounts When it comes to creating your nonprofit’s COA, there are generally three steps you’ll need to follow: Decide how you’ll categorize financial data. Provide a column for additional notes. Work With a Nonprofit Accountant.
It’s moments like these that cause me to reflect. In moments of reflection like these, there’s gratitude. . Charting "Top N and Others" via Table Calculations in Tableau. How to build and interpret an index chart using Tableau. Learn to build a Butterfly Chart in Tableau. Maddie Dierkes , Playfair Data.
This was useful for the introduction and pre-workshop activity, homework, and reflections. Thinking through a strategy requires more reflection and discussion within the organization and some level of experience with the tools. Use the smart chart to get communications strategy in place first. Setting up a blog.
Rather than start at the beginning, I’m starting at the end by sharing some tips for a formal reflection process that can lead to improving results of a project or event. A structured reflection process generates insights about what worked and what could be improved. Ask team members to reflect on their lessons learned.
Participants reflected on their style strength and how it has helped them be successful in different situations. We had some fun doing role plays with a partner to figure out their style and some reflection on how we needed to adapt. Reflection questions : “Why did this work?”. ask, “How have sales been going?”.
It’s moments like these that cause me to reflect. In moments of reflection like these, there’s gratitude. . Charting "Top N and Others" via Table Calculations in Tableau. How to build and interpret an index chart using Tableau. Learn to build a Butterfly Chart in Tableau. Maddie Dierkes , Playfair Data.
Don’t be afraid of “boring” bar charts. It can be tempting to go a long way and hack Tableau to create non-standard charts with deep visual appeal and a significant “wow” factor. Don’t forget, though, that you have an audience who want to understand your chart. although sometimes elaborate charts impress in other ways.
Spitfire’s useful SMART chart planning tool has been used by many nonprofits and was adapted for social media for nonprofits by NTEN’s WeAreMedia project several years ago. Finally, allocating time for a reflection about what worked, what didn’t based on an analysis of the data is critical.
The launch was a huge success, with Hyper Scape rising to the top of the Twitch charts that day. Update July 12th, 4:25PM ET : Updated headline to reflect that the beta is now available. In his experience with the technical test, my colleague Nick Statt found the game to be a fun and polished take on the battle royale formula.
Reflective Practice. Writing people’s ideas on a flip chart or white board helps with the group memory and knowledge capture. The chart writer’s role is to captures the groups ideas. Whenever possible, the chart writer writes down the speaker’s exact words. Here’s just a few: Instructional.
It’s a story common to all sectors today: investors only want to see ‘uppy-righty’ charts in a pitch. The responses were quite broad, and their breadth to an extent reflected their target customer groups and how those customers are reached. More posts by this contributor. The 2021 edtech avalanche has just begun.
Some of the main goals of the implementation meeting are to produce a consensus on the definition of: The chart of accounts. This blog will provide some suggestions on building your chart of accounts in a manner that is practical and that will satisfy as many users of the financial statements as possible.
Weve made a few charts to illustrate the explosive growth, fierce competition, and unprecedented adoption of these platforms. The time taken to reach 100 million users chart is a stark reminder of how fast things are changing in the digital world. All this, before January 2025, when the AI app race hit a new level of drama.
The ideas can be captured on a flip chart or participants can write them down on sticky notes and post them on a wall. Then you reflect on the difference in creative energy – typically yes and has more of it. Write them on a flip chart, white board, or slide so everyone can see it. Say the ground rules for brainstorming.
I used the wiki a flip chart - so the leave behind is the slide deck, notes, and a few resources. The techniques of face-to-face networking strategies are very much transferable to online tools. In fact, you need these skills to really reap the benefits of your professional online network. EPIP Slides View more presentations from kanter.
Charts and graphs work best when paired with writing that contextualizes them. For example, say an environmental nonprofit created a pie chart showing the different types of trees they’ve planted over time. However, many people struggle with putting meaning behind statistics when they’re presented solely in text.
Beautiful Business Dashboards: The How and the Why : Samuel Parsons and Simon Beaumont are masters at their craft, and it was so cool to see how these two took ordinary charts and made them absolutely beautiful, sharing some tips and tricks along the way. Let’s build a trellis chart! How to Highlight a Single Column in Tableau.
Design a program that reflects the customized service you want to deliver and the quality of outreach you want to produce. My first bit of advice is, don’t treat recruiting these experts casually. They will be representing your organization. Someone with the wrong attitude or who doesn’t understand the goals can do more harm than good.
He describes a simple technique of taking 5 minutes every morning to write down 3 important tasks to accomplish and then reminding yourself every hour as to whether you have completed those tasks using your iPhone alarm. And then reflecting at the end of the day for 5 minutes about what you accomplished.
Are you ready to level up your annual report to highlight the true value of your association? Learn how to refine your annual report to reflect your staff’s hard work and your organization’s accomplishments. Use infographics and charts to engage readers and highlight your most important information.
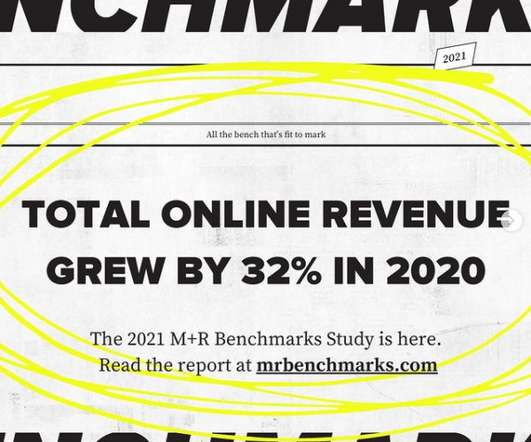
Go explore the findings, charts, and analysis at mrbenchmarks.com. . These findings reflect the determination of so many nonprofits to advance essential missions in the midst of uncertainty, hardship, and tragedy. We are excited to report that the 2021 M+R Benchmarks Study is ready for you.
Mine includes markers , sticky notes , index cards, and flip chart paper. More recent books on these methods include Gamestorming by Dave Gray, Sunni Brown, and James Macanufo and Visual Meetings by David Sibbet (I took David Sibbet’s workshop on visual meeting facilitation and wrote up some reflections here.).
I'm happy that my new laptop has an extended battery life so I am writing some reflections on the plane en route to Boston. What I most enjoy about doing face-to-face training workshops is the right after reflection questions: How could this learning experience been improved? What worked? What didn't? Observations.
We organize all of the trending information in your field so you don't have to. Join 12,000+ users and stay up to date on the latest articles your peers are reading.
You know about us, now we want to get to know you!
Let's personalize your content
Let's get even more personalized
We recognize your account from another site in our network, please click 'Send Email' below to continue with verifying your account and setting a password.


Let's personalize your content