This site uses cookies to improve your experience. To help us insure we adhere to various privacy regulations, please select your country/region of residence. If you do not select a country, we will assume you are from the United States. Select your Cookie Settings or view our Privacy Policy and Terms of Use.
Cookie Settings
Cookies and similar technologies are used on this website for proper function of the website, for tracking performance analytics and for marketing purposes. We and some of our third-party providers may use cookie data for various purposes. Please review the cookie settings below and choose your preference.
Used for the proper function of the website
Used for monitoring website traffic and interactions
Cookie Settings
Cookies and similar technologies are used on this website for proper function of the website, for tracking performance analytics and for marketing purposes. We and some of our third-party providers may use cookie data for various purposes. Please review the cookie settings below and choose your preference.
Strictly Necessary: Used for the proper function of the website
Performance/Analytics: Used for monitoring website traffic and interactions
Alyssa Jenson November 14, 2023 - 6:59pm Sue Kraemer Senior Data Skills Curriculum Strategy Manager, Tableau Charts are all around us. When viewing and creating charts, it’s vital that we gain the ability to critically explore and discern the integrity of the information and conclusions shown in charts. Don’t be SCAM’d!
Airbnb filed to go public today , bringing the well-known unicorn one step closer to being a public company. ai themselves filed to go public in what could be a rush to the public markets by richly valued startups. Up top in Airbnb’s S-1 is a chart that shows monthly bookings on its platform.
This quarter, strong earnings results from public cloud companies were overshadowed by a seemingly endless IPO cycle. Another moment we somewhat missed over the last few weeks was the stock market pushing the value of public cloud companies to all-time highs. Public acceleration. These events are connected.
Editor's note: This article originally appeared in Tableau Public. When you want to explore, create, and share data visualizations, we're happy to share that you can start creating vizzes directly from a browser on Tableau Public with the web authoring beta. If you don’t have a Tableau Public profile, create one for free.
For the public at-large, the most popular resolutions are exercising more, eating healthier, losing weight, and saving more money, followed by more time with family and friends, and spending less time on social media. Sadly, only about 10% of the general public comes through on New Years resolutions when December 31st rolls around.
The Red Cross provided a publicly available link to a chart detailing expenditures within Haiti starting in 2010 and running through today ( [link] ). The total of expenditures listed was more than $490 million. The post American Red Cross Sued Claiming Haitian Relief Funds Misused appeared first on The NonProfit Times.
Israel’s ironSource , an app-monetization startup, is going public via a SPAC. But before you tune out to avoid reading about yet another blank-check company taking a private company public, you’ll want to pay attention to this one. That ironSource intends to go public with a valuation of $11.1
The Bessemer Cloud Index (trackable as the $WCLD ETF ), a basket of public software stocks, has lost ample ground thus far in 2022 (the following chart has a five-day range, so mind the dates): Image Credits: YCharts. Thus the connection between public company prices and the value of startups. The index is off around 5.8%
And the company’s debut may prove to be the final major edtech IPO ahead of Byju’s eventual debut — how well Udemy performs in its public offering could impact others in its market, including some incredibly wealthy education technology players. The Exchange explores startups, markets and money. Revenue mix.
That possibility became a reality for AARPs Public Policy team when we partnered together to improve a digital tool its constituents use to inform long-term services and supports (LTSS). Our goal for the new AARP LTSS Scorecard website was to design a chart anyone could look at and understand immediately how a state was doing.
Klassen and Tudorancea/Tableau Public]. Tableau Stunning Charts Series?Radial Radial Column Chart. Chart Chat Live — Round 24. Understanding Index Charts and Log Scales. How to build an interactive line chart comparing across quarters. View last month’s Viz of the Day on Tableau Public gallery.
Rumours now ranks seventh on the Billboard 200 chart, the publication announced last night , the album’s first appearance in the top 10 since 1978, a year after it debuted. Billboard ’s chart measures album “units” moved each week in terms of sales, track purchases, and streams. Billboard says it counted 30.6
Identify Your Public Associations have several broad categories of constituents including members, industry professionals, prospective members, and the public. Industry publications and research—Identify which authors are most visible and command the greatest credibility. There are multiple smaller interest groups in each area.
Don’t be afraid of “boring” bar charts. It can be tempting to go a long way and hack Tableau to create non-standard charts with deep visual appeal and a significant “wow” factor. Don’t forget, though, that you have an audience who want to understand your chart. although sometimes elaborate charts impress in other ways.
The publication said two sources confirmed the matter, adding that Pei no longer appears in OnePlus’ most recent organizational chart. No reason was given for his departure.
They are implying that they will wait to go public until they can price an IPO higher than or at least at the same valuation as their last funding round. This further implies that the company is opposed to down rounds or publicizing a decrease in their valuation. Using the chart.
Option 2: Use Tableau Public. If you aren’t a current student, you can either use the online version or download Tableau Public onto your machine for free. Tableau Public is a free platform to explore, create, and publicly share data visualizations online. Recommended Charts. chart title. Making Groups. rows shelf.
Robinhood has shown an impressive ability to raise enormous amounts of capital in the past few weeks to ensure it has the funds needed to allow users to trade and, presumably, provide it with enough cash until it goes public. Here’s the chart the company published, which I have loosely marked with quarterly intervals. Raising $3.4
Click to see Darragh's full interactive viz on Tableau Public. Part 2 The Build: An Annual Sunburst Chart Template. Tableau Coxcomb Chart Template. Sizing a Trellis Chart in Tableau. Using Tableau Public Templates Efficiently. How (& Why) To Build a Diverging Bar Chart in Tableau. Darragh Murray.
Click to see Darragh's full interactive viz on Tableau Public. Part 2 The Build: An Annual Sunburst Chart Template. Tableau Coxcomb Chart Template. Sizing a Trellis Chart in Tableau. Using Tableau Public Templates Efficiently. How (& Why) To Build a Diverging Bar Chart in Tableau. Darragh Murray.
The Flerlage Twins take a longer view and look at their ten favourite Tableau Public vizzes of all time. Click to view their full visualization on Tableau Public. How to Create a Variation Chart. How to Build a Rank Chart in Tableau? Charting Project Flow via Multiple Data Densifications. Check out #VizCollab.
As is common from the bank’s publications, it’s a dense riff of charts and notes, ranging from economic data and trade figures to venture capital statistics. SVB data shows a useful 2020 versus 2021 differential, with an aggregate chart tracking the same data over a longer time period on the right: Image Credits: SVB.
Option 2: Use Tableau Public. If you aren’t a current student, you can either use the online version or download Tableau Public onto your machine for free. Tableau Public is a free platform to explore, create, and publicly share data visualizations online. Recommended Charts. chart title. Making Groups. rows shelf.
But the city of 76,000 could soon be known for something else: its AI-powered mass civic engagement project that is using public surveys to chart the future of the city. Figuring out what to do about that vexes the public officials in Bowling Green and the greater Warren County. A summary by definition is a lossy act.
Don’t be afraid of “boring” bar charts. It can be tempting to go a long way and hack Tableau to create non-standard charts with deep visual appeal and a significant “wow” factor. Don’t forget, though, that you have an audience who want to understand your chart. although sometimes elaborate charts impress in other ways.
Klassen and Tudorancea/Tableau Public]. The mix of design with storytelling is well balanced; the story [they’re] telling is very clear and so we have charts that are easy to read … Any decisions to go off the beaten track feel like they've been made with intent.” . — Tableau Stunning Charts Series?Radial Radial Column Chart.
Airbnb filed to go public yesterday, offering the world a look into its financial performance over the past several years. But past our overview of Airbnb’s core financial results and our look into which investors will make the most from its public debut, there are still questions that need answering. Let’s get to work!
The cryptocurrency-focused consumer trading concern is set to become a public company on the back of a strong 2020, and a particularly strong final quarter. Kicking off with Coinbase, The Block’s Frank Chaparro got us thinking this morning by tweeting the following chart: You can see why the chart caught our eye.
There’s widespread damage as a result of all of those red charts plummeting down and to the right: The decline in the value of public software companies has been a key leading indicator for the present slowdown in venture capital activity, for example, and the ability of startups to push their own valuations higher.
An organizational chart. Feature new directors prominently throughout your social media platforms and send press releases to their local publications and news outlets. These are a few of the documents that can be included in online welcome handbooks: Bylaws. Financial statements. Minutes of recent meetings. A calendar of events.
The rapidly appreciating startup price chart is interesting, and we’ll unpack it. Prices are going up as well, as the following chart shows: Image Credits : PitchBook. Those charts belie somewhat how quickly venture capital is changing. While the data covers the U.S. Let’s talk about some big numbers.
New Viz* The Cost of Data: One sheet, two chart. Creating Custom Gauge & Needle Charts in Tableau. Place Bar Chart Labels Above Bars in Tableau. View last month’s Viz of the Day on Tableau Public gallery. Tableau Formatting Series: How to Use Shading and Backgrounds. Felicia Styer, , Playfair Data. Inspiration.
In a world where newsrooms are shrinking fast, innovative placement can help get your voice out there and shape public consciousness. Check out the handy if this/then that chart below for new ideas — mix and match for placement ideas to drive your next brainstorm! Need more ideas?
Some well-known VC firms have spent the last few months crunching data while working to chart, graph, and map the world of venture investing. Regardless, Bessemer’s 2021 cloud report is out, and it assists some of the work we did with Battery’s charts. If not, don’t worry — I have charts. Got all that?
There are the “haves” (public companies with revenue growth of over 30%) and the “have nots” (everyone else) of B2B software. The chart below demonstrates just how drastically the “haves” separated themselves from the rest. The flow of capital in SaaS is becoming increasingly bifurcated.
Bring the WOW Factor with Tableau Public Portfolios : Ghafar Shah and Chantilly Jaggernauth shared some amazing insights on how you can use Tableau Public to grow your skills, expand your network, and land that dream job. Let’s build a trellis chart! Totally Useless Charts & How to Build Them – Lotus Flowers.
Combining his experience as an operator and institutional investor, Abelson runs Irving as a multi-strategy platform making long-term durable investments in both the public and private markets. The public markets have trended downwards, investor priorities have shifted, and the IPO window is essentially shut, with Q1 IPOs (18 deals with $2.1
It was also reported this morning that Tesla’s Model 3 became the first electric vehicle to top monthly sales charts in Europe this September. To publicize the move, Hertz has launched a new ad campaign featuring Tom Brady. The automaker’s stock was up 4.3 percent on the news in pre-market trading. GOAT’s recognize GOAT’s.
There are a number of ways to take a private company public: You can pursue a traditional IPO, sell a chunk of shares at a set price and start trading. And it’s what we’re discussing today, because there are a few upstarts going public via special purpose acquisition companies (SPACs, or blank-check companies) worth checking out.
The Flerlage Twins take a longer view and look at their ten favourite Tableau Public vizzes of all time. Click to view their full visualization on Tableau Public. How to Create a Variation Chart. How to Build a Rank Chart in Tableau? Charting Project Flow via Multiple Data Densifications. Check out #VizCollab.
Charting "Top N and Others" via Table Calculations in Tableau. How to build and interpret an index chart using Tableau. Learn to build a Butterfly Chart in Tableau. Nicole Lillian Mark , SELECT * FROM data; Chart Chat Live — Round 32. How to Drill into a Bar Chart Using Sets in Tableau. Andy Kriebel , VizWiz.
Even if you are a capital campaign beginner, you probably know that these campaigns have a quiet phase and a public phase. Then, you’ll announce your campaign and begin the public phase. In this post, we’ll explore five tips that will help you market your capital campaign during the public phase so you can meet your goal!
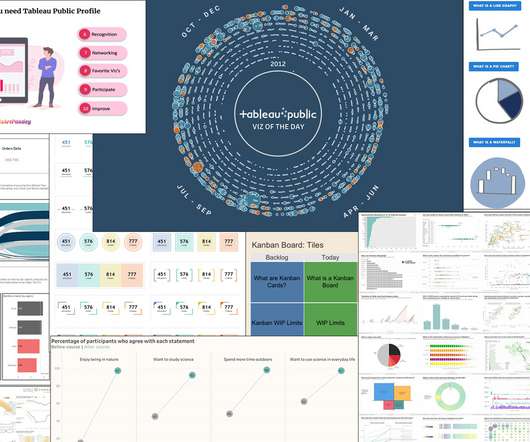
Team Tableau Public. Despite it all, one thing remained steadfast: the Tableau Public global community of data enthusiasts’ commitment to bringing impactful (and often mindblowing) data insights to life. Each day, the Tableau Public team selects and features a “Viz of the Day” (VOTD) based on a variety of criteria.
Avinash Reddy Munnangi recently wrote a blog post on 10 Reasons Why You Need a Tableau Public Profile , and it’s spot on! In the visual analytics space, there is truly nothing like Tableau Public. I’ve been a part of the Tableau Public community for five years now, and I’m so thankful for this community. It’s 100% free. .
We organize all of the trending information in your field so you don't have to. Join 12,000+ users and stay up to date on the latest articles your peers are reading.
You know about us, now we want to get to know you!
Let's personalize your content
Let's get even more personalized
We recognize your account from another site in our network, please click 'Send Email' below to continue with verifying your account and setting a password.


Let's personalize your content