article thumbnail

Who is sharing nonprofit demographic data with Candid? 

Candid

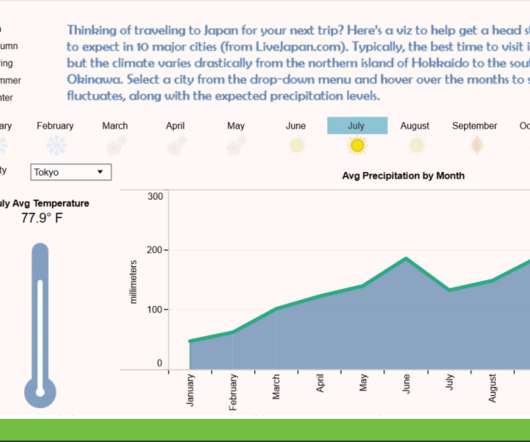
The chart below compares the proportion of nonprofits by subject area overall (in blue) with that of the subset of nonprofits sharing demographic data (in orange). In the chart below, we compared sharing rates by different staffing levels and demographic categories, including race/ethnicity, gender, sexual orientation, and disability status.

article thumbnail

Top 2021 Fundraising Strategies: Mastering an Analytical Approach to Strategy and Planning

Bloomerang

One of the biggest problems nonprofits face is improving their low donor retention rate. If you have no idea what a good or poor donor retention rate is, it’s difficult to measure your own performance. For example, retention rates tend to be higher for mid-level and major donors. That which gets measured gets done!

Analytics 126
professionals

Sign Up for our Newsletter

This site is protected by reCAPTCHA and the Google Privacy Policy and Terms of Service apply.

Trending Sources

article thumbnail

Building evidence and innovating programs to reduce disparities in children’s well-being 

Candid

The Race for Results index standardizes scores across 12 indicators that represent critical milestones—including fourth-grade reading and eighth-grade math proficiency, high school graduation rates, likelihood of living in low-poverty areas, and educational attainment and employment as young adults. government’s Supplemental Poverty Measure.

article thumbnail

SXSW 2013: Measurement and Making Sense of Your Data

Beth's Blog: How Nonprofits Can Use Social Media

This post summarizes the sessions I facilitated or participated in related to “ Measuring the Networked Nonprofit ,” which included a book signing, panel discussion in the Beacon Lounge , and a workshop with co-author KD Paine. KD says don’t use pie charts, plot your data over time.

Measure 98
article thumbnail

Do You Know Your Nonprofit's Facebook Page Churn Rate?

NTEN

Basically, "churn" is the term used to describe the rate at which subscribers – be they in your email lists, Facebook fans, Twitter followers, etc. The average churn rate in 2010 for nonprofits in our research sample was 14%. To whet your appetite for the full report, here's a great peek at the charts regarding Facebook page churn:

Rate 95
article thumbnail

Integration: The Ultimate Solution for Nonprofit Data Silos

sgEngage

Data integration allows nonprofit healthcare organizations to: Exchange data at a faster rate. This leads to measurable growth and improved patient results. Additionally, this digital shift to increased data interoperability means less chart chasing and improved quality care. Standardize data formats to ensure consistency.

article thumbnail

Get Your Small Business on the Map: 5 Digital Marketing Tips

Nonprofits Source

Remember to choose the communication channels your audience is already familiar with, and chart a customer journey that moves each prospect carefully down the sales funnel. Collect digital marketing KPIs Key performance indicators (KPIs) are metrics used to measure your digital marketing success.

Map 52