This site uses cookies to improve your experience. To help us insure we adhere to various privacy regulations, please select your country/region of residence. If you do not select a country, we will assume you are from the United States. Select your Cookie Settings or view our Privacy Policy and Terms of Use.
Cookie Settings
Cookies and similar technologies are used on this website for proper function of the website, for tracking performance analytics and for marketing purposes. We and some of our third-party providers may use cookie data for various purposes. Please review the cookie settings below and choose your preference.
Used for the proper function of the website
Used for monitoring website traffic and interactions
Cookie Settings
Cookies and similar technologies are used on this website for proper function of the website, for tracking performance analytics and for marketing purposes. We and some of our third-party providers may use cookie data for various purposes. Please review the cookie settings below and choose your preference.
Strictly Necessary: Used for the proper function of the website
Performance/Analytics: Used for monitoring website traffic and interactions
Source: Gemma Correll – I Love Charts. Note from Beth: I just knew that I was going to start obsessing about charts and graphs after my Excel spreadsheet obsessions started. What better way than in Excel. Step 1: Which Chart is Best? If your data adds up to 100%, you might choose a pie chart.
Alyssa Jenson November 14, 2023 - 6:59pm Sue Kraemer Senior Data Skills Curriculum Strategy Manager, Tableau Charts are all around us. When viewing and creating charts, it’s vital that we gain the ability to critically explore and discern the integrity of the information and conclusions shown in charts. Chart Design.
Source: Juice Lab Chart Chooser. Last month, Stephanie Evergreen wrote an awesome guest post called “ Six Steps to Great Charts ” with lots of practical tips for using the Excel chart feature to visualize your social media measurement data. The six steps: Step 1: Which Chart is Best? Step 6: Annotate.
But I also love using those pens for visualization techniques and especially to sketch out charts and graphs. I did a deep dive on data visualization techniques while working on a chapter of my next book, Measuring the Networked Nonprofit , with co-author KD Paine. That’s when I heard about the book, “ I Love Charts.”
Strategy: Charting the Course to Thrive A well-crafted strategy isnt just a planits the compass that guides your association toward sustainable success. Measure Success with Clarity: Define key performance indicators (KPIs) to evaluate progress and adjust as needed. Agility is the backbone of a future-ready strategy.
The Australian Broadcast Company’s ABC News app shot to the top of Apple’s App Store charts in Australia over the course of the last few days, not long after Facebook banned Australian news sources on its platform. 1 in the news app charts. Image: ABC News. ABC News currently sits at No. it became the most downloaded app in Australia.
I think sometimes there is a disconnect between measurement and the actual practice. In some organizations, measurement is this thing done at the end to justify or validate social media. These are the practice indicators for measurement – for three different areas – analysis, tools, and sense-making.
KD Paine , my co-author of the Measuring the Networked Nonprofit (due out in later in 2012), pointed me to this gem of a measurement checklist in an infographic format. I like the positive frame they put on measurement malaise and the hat tip to Kobler-Ross. Denial: You can’t measure it.
TikTok and Billboard are partnering to launch an official TikTok Billboard Top 50 Chart that tracks the most popular songs on the short-form video-sharing app, the company announced today. The chart will measure the hottest songs on the platform each week based on the number of views, user engagement and how many videos are made […]
As I’ve been working on “ Measuring the Networked Nonprofit ” with co-author KD Paine, we’ve come to the chapter on measurement tools. I sent out a query nonprofit tech colleagues who are social media mavens and ask that age old question, “ What’s in your social media measurement tool box ?”
“In the past year I have been struck again and again by how important measurement is to improving the human condition. You can achieve amazing progress if you set a clear goal and find a measure that will drive progress toward that goal—in a feedback loop. You use the measurement as feedback to make adjustments.
Five Steps You Can Take Now to Apply the New Measurement Standards In Your Organization. Everything You Need to Know about the Dublin Summit and the New Measurement Standards. SMMStandards Progress and Roadmap: Marklein and Paine Present the First Social Media Measurement Standards at the Dublin Summit. But where to start?
This post summarizes the sessions I facilitated or participated in related to “ Measuring the Networked Nonprofit ,” which included a book signing, panel discussion in the Beacon Lounge , and a workshop with co-author KD Paine. KD says don’t use pie charts, plot your data over time.
I Love Social Media Measurement. I tested out the five phases of falling in love with measurement. Given the topic was measurement, I couldn’t help but go a little meta and play with incorporating learning analytics into the instruction. This blog post shares some insights about those two somewhat disconnected ideas.
At the same time, it can be a real challenge for association staff to translate them into something measurable. It involves: Defining What to Measure: Identify the specific metrics that align with your strategic goals. ” It’s helpful to break these high-level goals down into measurable components.
When nonprofits started to read and apply our book, ” Measuring the Networked Nonprofit ,” I noticed this tweet from the ACLU in NJ showing a white board capturing their team meetings to define success for social media. How did your organization apply it to social media measurement? What is your measurement pilot?
A logic model helps to visualize those details and highlight the connection between a program's purpose and the programs results, and it helps you make sure you're measuring the right things so you can show success! Ananda Roberts Data Leadership logic models nptech nten Communications Program'
Dashboards are a nonprofit’s best friend because they can be powerful tools in communicating your organization’s important measurement data at a glance. 4) Choose the Right Measure. Stare at your charts and graphs and numbers. Step C: Select the right chart. (5) 5) Choose the Right Display.
AARP helps policymakers by providing a digital scorecard that measures how states nationwide perform across different categories, such as nursing home costs or long-term care insurance. Our goal for the new AARP LTSS Scorecard website was to design a chart anyone could look at and understand immediately how a state was doing.
As part of my work as Visiting Scholar at the Packard Foundation this year, I’m facilitating a peer learning group based on “ Measuring the Networked Nonprofit ” and the next session we are focusing on the sense-making step of measurement. The deck provides specific practical advice on charts, color, and maps.
Ateken Abla November 14, 2023 - 6:59pm Sue Kraemer Senior Data Skills Curriculum Strategy Manager, Tableau Charts are all around us. When communicating with data, viewing a chart instead of a table of numbers helps us quickly understand data, make comparisons, see patterns, and make better decisions. Be aware of the SCAM!
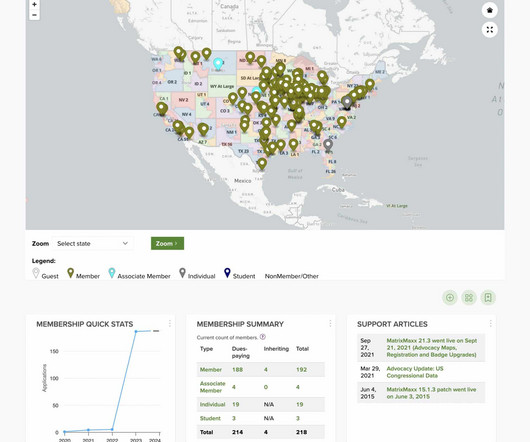
Each dashboard can be tailored to help measure what is important to your association, and relevant to your memberships. Membership Churn, in particular, charts members lost over a specific time period, providing a crucial metric alongside membership retention.
I’ve been facilitating a peer learning group with Packard Foundation grantees during the past year with a goal of improving measurement practice for social media and based on my book, “ Measuring the Networked Nonprofit.” On a call last month, participants shared examples of their measurement tools and spreadsheets.
Data nerds know how to clean and recode data, look for patterns, calculate key statistics, and then show off the most important information in graphs and charts. Here’s an example where I created data bars —miniature within-cell bar charts—to quickly compare each youth’s pretest score and posttest score. Why get good at Excel?
It includes a tool that helps measure your networking skills and also lots of methods to help you identify, expand, and use your network to improve your knowledge and work. This book is how to create a data-informed culture in your organization that values outcome based measurement. Impact and Excellence by Sheri Chaney Jones.
After helping my kids with math homework (they had to represent some data in a chart), I found this awesome, free chart maker at the National Center for Education Statistics. But the bonus was the tutorial to help you better understand and apply charts. That’s the most important thing to me, anyway.
Crowdbooster is another Twitter analytics tool that gives you a lot of interesting charts and graphs and data. I couldn’t actually use it because I have too many followers and it took too long to synch, but they’re coming out a version to handle this problem. What I find most useful is the list of your top retweeters.
Rumours now ranks seventh on the Billboard 200 chart, the publication announced last night , the album’s first appearance in the top 10 since 1978, a year after it debuted. Billboard ’s chartmeasures album “units” moved each week in terms of sales, track purchases, and streams. Billboard says it counted 30.6
“I’ve never seen so many people so fixated on a cluster of charts,” notes Amanda Makulec. “At And as the pandemic dominated every aspect of our lives in 2020, there seemed to be a corresponding chart to go with it. Don’t rely on any single measure to tell the full story. Open data initiatives and data transparency matter.
In PassMark’s CPU Mark test measuring single thread performance, the Ryzen 5 5600X scored a chart-topping 3,495 points. The next highest score on the list belongs to the Intel Core i9-10900K (a $550 CPU) at 3,175.
Ateken Abla November 14, 2023 - 6:59pm Sue Kraemer Senior Data Skills Curriculum Strategy Manager, Tableau Charts are all around us. When communicating with data, viewing a chart instead of a table of numbers helps us quickly understand data, make comparisons, see patterns, and make better decisions. Be aware of the SCAM!
For example, when mapping out a timeline for a software implementation or chart of accounts restructuring, you will want to incorporate time for your team’s expected busy seasons when they will have other high priorities, such as preparing for an audit or year-end close.
Ateken Abla November 14, 2023 - 6:59pm Sue Kraemer Senior Data Skills Curriculum Strategy Manager, Tableau Charts are all around us. When communicating with data, viewing a chart instead of a table of numbers helps us quickly understand data, make comparisons, see patterns, and make better decisions. Be aware of the SCAM!
Ateken Abla November 14, 2023 - 6:59pm Sue Kraemer Senior Data Skills Curriculum Strategy Manager, Tableau Charts are all around us. When viewing and creating charts, it’s vital that we gain the ability to critically explore and discern the integrity of the information and conclusions shown in charts. Don’t be SCAM’d!
For nonprofits, those are not solely money or efficiency for everything that could be measured. By aligning social media to organizational objectives and using measurement, you can answer the question: of all the ways we could be investing our resources, is social media the best choice to see the social change results that we want to see?
Give me an interactive map, a pivot table, even a plain old pie chart and I’m happy. Why are you measuring or tracking something that you can’t (or don’t want to) impact? This post originally appeared on the NTEN blog – you can also read the full post and join the conversation on the NTEN.org website.
The ALDOT flies drones over construction projects each business day of the week and uses data collected to help with things like making sure erosion control measures, including silt fences, are installed properly.
Spitfire’s useful SMART chart planning tool has been used by many nonprofits and was adapted for social media for nonprofits by NTEN’s WeAreMedia project several years ago. It is also important to think about what specific metrics are needed to measure along the way. How will you measure them along the way?
Yesterday, KD Paine and I delivered an NTEN Webinar on measurement based on the ideas in our new book ” Measuring the Networked Nonprofit: Using Data to Change the World.” ” I often hear nonprofits say, “We don’t have those skills within our organization so we don’t do measurement.”
Last week, I facilitated a mini-innovation lab on measuring impact for grantees of the Google Nonprofit program at the Impact Hub. We started off with an affinity clustering of the strengths, challenges, and opportunities for improving their organization’s practice of measuring impact and communicating about it.
It has been almost exactly four years since I published Measuring the Networked Nonprofit: Using Data to Change the World , with co-author, Katie Paine. Back then, not many nonprofits were talking or practicing the use of measurement and data to improve nonprofit results. Refinable – adapt to rapidly changing environments.
There are companies and tools that offer “solutions&# for tracking, measuring, and even “engaging&# with your community online. Create a chart – either on a whiteboard, a flipchart, or even a document on your computer. So, I thought I’d take the time to document my recommended processes here! A note about DIY.
I learned about measurement from Katie Delahaye Paine, who is the leading expert in measuring communications strategies. I was honored enough to co-author a book with Katie, “ Measuring the Networked Nonprofit ,” a book about measuring social media and networks. So, I know first-hand how incredibly brilliant she is!
What we do: Benetech's Human Rights Data Analysis Group (HRDAG) develops database software, data collection strategies, and statistical techniques to measure human rights atrocities. Design and implement data visualizations, including everything from simple static charts and maps to custom interactive visualizations on the web.
We organize all of the trending information in your field so you don't have to. Join 12,000+ users and stay up to date on the latest articles your peers are reading.
You know about us, now we want to get to know you!
Let's personalize your content
Let's get even more personalized
We recognize your account from another site in our network, please click 'Send Email' below to continue with verifying your account and setting a password.


Let's personalize your content