6 Tips For Creating Better Charts With Your Nonprofit’s Data
TechImpact
AUGUST 20, 2013
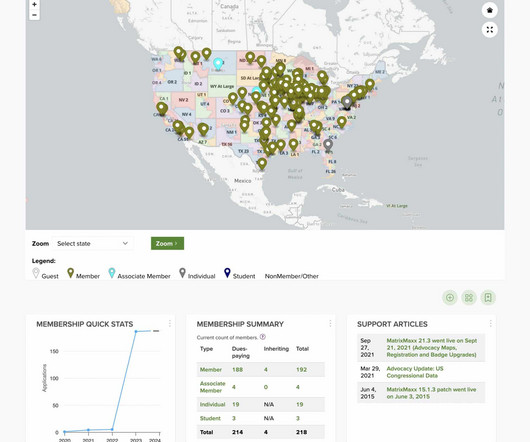
Beth’s blog shares Ann Emry’s tips for creating charts with your nonprofit’s data. Charts can turn plain text into a visually, expressive piece of information, which is great for persuading donors to donate or showing your supporters your organization’s impact. Chart diversity. Visual communication.


Let's personalize your content