This site uses cookies to improve your experience. To help us insure we adhere to various privacy regulations, please select your country/region of residence. If you do not select a country, we will assume you are from the United States. Select your Cookie Settings or view our Privacy Policy and Terms of Use.
Cookie Settings
Cookies and similar technologies are used on this website for proper function of the website, for tracking performance analytics and for marketing purposes. We and some of our third-party providers may use cookie data for various purposes. Please review the cookie settings below and choose your preference.
Used for the proper function of the website
Used for monitoring website traffic and interactions
Cookie Settings
Cookies and similar technologies are used on this website for proper function of the website, for tracking performance analytics and for marketing purposes. We and some of our third-party providers may use cookie data for various purposes. Please review the cookie settings below and choose your preference.
Strictly Necessary: Used for the proper function of the website
Performance/Analytics: Used for monitoring website traffic and interactions
Your Chart of Accounts/Class List Becomes Unwieldy Nonprofit accounting, and fund accounting in general, is all about tracking, managing, segmenting, and reporting on individual funds. You have multiple income streamsdonations, grants, service feesas well as all the ways you use the money. Think Bigger! The reason is simple.
You have data on your grantees flowing into your grant management system (GMS) through applications and their updates. Your own historical data on grants awarded accumulates with every grant cycle. Using Lists in Your Grant Reporting. Using Charts in Your Grant Reporting.
Using a fund accounting system with a segmented chart of accounts requires fewer clicks and selections to track an expense, which reduces the potential for errors and helps to ensure your data integrity. And, of course, if you earned a government grant, the reporting can be even more complex.
At Candid, grants data from 990s flows into tools such as Foundation Directory , public dashboards that provide insights into philanthropy in different regions across the U.S., Sourcing grants data from 990s isn’t ideal to begin with—grant descriptions from filings are often sparse, and sometimes grants lists are missing entirely.
For example, you need to make sure the grant or endowment money you are spending for a particular program is being spent according to the grant or endowments terms. Now, instead of each dollar being budgeted to a single account, it can be tracked across accounts, programs, and even grants.
In service of this, in this blog, we’re highlighting five things we’ve heard about our grants data that aren’t quite accurate. Myth 1: “Candid grants data” is the same as “990 data.” institutional grantmaking and provide the starting place and scaffolding for Candid’s grants data. Years ago, this was true. institutions.
will focus on donor cultivation, an essential step to getting the grant. We are here to talk about how to get more grants, specifically through donor cultivation. You can even do grant tracking, which we love as well. Her initials may be MBP, but to me, she’s the MVP of grants. Margit Brazda Poirier, GPC, M.S.
Consider these audience sectors when writing your report: Donors Volunteers Community leaders Future board members Supporters (in-kind) Elected officials Potential partners, grant funding entities Allow three to four months to prepare your report : Create an outline Gather and organize content Engage your management team Design Review/Proof Print Prepare (..)
The person who coined the term “cat herding” may have been a grants manager. Whether your grantmaking organization is managing one funding program or a dozen, the right grants management software can save you time and improve compliance through streamlined processes, intuitive reporting, and built-in due diligence.
Their hopes and struggles and agonies Get us grants and consulting fees. The Red Cross provided a publicly available link to a chart detailing expenditures within Haiti starting in 2010 and running through today ( [link] ). There’s a market for their pain, Votes and glory and money to gain. Let us celebrate the poor.
Grant Research Tip: If a deadline has passed for a funder’s grant opportunity, don’t despair. Wait until after their grant consideration window has passed and then reach out to start an introduction. Their “Healthier Kids For Our Future” grants focus on food insecurity and mental health. Funding Priority: Mental Health.
Introducing the Chart of Accounts (COA) Are you ready to nerd out on nonprofit accounting? Introducing the Chart of Accounts (COA) - the foundational accounting tool every nonprofit leader needs to get right for maximum financial insight and awareness. What is a Chart of Accounts? It’s just that important.
While most nonprofits find funding from a variety of sources, one of the staples of charitable support comes in the form of grants. Consequently, nonprofit professionals should be well versed in crafting and compiling well-written grant proposals. If you referenced any visuals – pictures, charts, tables, graphs, etc. –
Grant Research Tip: If a deadline has passed for a funder’s grant opportunity, don’t despair. Wait until after their grant consideration window has passed and then reach out to start an introduction. Their “Healthier Kids For Our Future” grants focus on food insecurity and mental health. Funding Priority: Mental Health.
Topping the charts of most-read Candid blogs of 2022: the overhead myth. An open grant report to MacKenzie Scott and Dan Jewett by Ann Mei Chang of Candid. The post Topping the charts in 2022: The 10 most-read Candid blogs appeared first on Candid Blog.
Candid’s grants data set currently includes comprehensive information about over 30 million grants and other philanthropic transactions, such as pledges, in-kind gifts, program-related investments, etc. This typically resulted in about 900-1,300 funders represented and 100-150k grants collected in a given year.
In 2020, nonprofits raised around 20% of their income from grants. Grant funds from foundations, government entities, and corporations help nonprofits diversify their income streams. Below, we’ll cover nine best practices and tips on how to write a winning grant proposal. Leverage Language and Formatting From Past Grants.
"Getting actionable financial data for grant writing all comes down to the setup of your financial systems." You know that you need to finish this grant request, but you’re stuck. The narrative is coming along, but your roadblock is the financial justification for the grant. And you’re right.
It is simple enough to know where you are soliciting in person, sending a letter, or submitting a grant application. Here’s a chart with state-specific charitable registration details. States define solicitation as the act of asking for donations, regardless of the method of solicitation.
The dashboards on your grant management system give you a similar snapshot of your grantmaking programs. What Are Dashboards in Your Grant Management System? The dashboards act as the welcome screen in your grant management system. Are you going too fast? Is there enough air in your tires? Is it time for an oil change?
The chart clearly shows the connection between spiritual engagement and giving. An individual scores five points for each of those, for a total of 25 points. Less frequent engagement in each activity scores fewer points; no engagement scores no points.
In other words, you need to get your money from many different sources, not just one awesome foundation, one government grant, or one generous donor. If you rely solely on a government grant, what happens when the agency changes its eligibility criteria and you no longer qualify? No private foundation grants. Cue the sad music.
Design and implement data visualizations, including everything from simple static charts and maps to custom interactive visualizations on the web. Familiarity with python, R, and JavaScript libraries for charting, mapping, and vis is helpful. Perform a little bit of GNU/Linux system administration.
One of the most common reasons people analyze Candid’s grant data is to understand year-over-year giving trends in the sector. At Candid, we collect data on millions of grants and other transactions awarded by hundreds of thousands of funders across the globe. foundations in a given year (see chart below). Pledges are excluded.
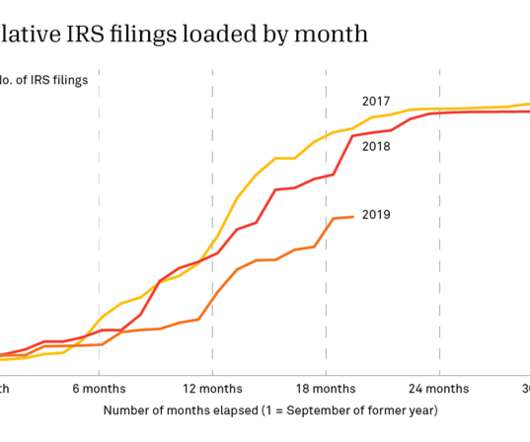
For example, about 75% of Candid’s grants data is sourced from Forms 990). The chart above shows the number of 990 filings ii that Candid has for years 2017–2022. To illustrate how recent delays compare to traditional delays, we plotted the number of IRS filings we’ve received each month for a given fiscal year (FY) in the chart below.
In a small, grant-funded organization, you might not have these skills and that’s ok! Your point of contact understands the importance of monitoring patient traffic trends, developing economies of scale, and identifying grants that will shore up revenue streams. This person shouldn’t be the clerical or data entry person.
A chart of accounts (COA) is the foundation for all financial reporting. 3 Steps to Create a Chart of Accounts When it comes to creating your nonprofit’s COA, there are generally three steps you’ll need to follow: Decide how you’ll categorize financial data. Take an Organized Approach. Audit Your COA Over Time.
Grant-funded nonprofits know compliance isn’t a nice-to-have. You might be able to win back an unhappy donor with a new program or event, but grant funders usually don’t get excited about silent auctions. Adhering to requirements and guidelines is how you establish trust with the granting agency so you can get additional funding.
Her third round of grants in less than a year, Scott wrote that grant recipients were “286 high-impact organizations in categories and communities that have been historically underfunded and overlooked.” Editor’s note: Scott awarded a grant to Candid.) . Our analysis of Scott’s 2020 grants is available here.) .
James and Oliver will be live on the December Chart Chat. As a data professional, working at Tableau, it's easy sometimes to take data for granted. I interviewed Tim for an episode of If Data Could Talk , and he joined my co-hosts for a geeky dive into his favorite charts on Chart Chat. Living in Data. Note: in the U.S.,
While this solution works temporarily, spreadsheets arent equipped to handle complex recordkeeping needs that will likely become more prevalent as your organization grows, such as payables, receivables, and grant management. Track grant progress, either within the software or through an integration with a dedicated grant management system.
Many platforms you already use for your grantmaking processes have modern APIs built in, such as your grant management solution that surfaces due diligence data from third-party sources within your GMS. You can use APIs to create dashboards, reports, and charts that show your grantmaking performance, impact, and trends.
Consider these audience sectors when writing your report: Donors Volunteers Community leaders Future board members Supporters (in-kind) Elected officials Potential partners, grant funding entities Allow three to four months to prepare your report : Create and outline Gather an organize content Engage your management team Design Review/Proof Print Distribute (..)
Thanks to a generous grant from the Lavelle Foundation, Bookshare has been able to work with Worth Trust, a nonprofit with offices in Chennai, India. They now work with higher level books with charts, graphs and equations and can turn around books for us in 24 hours if necessary. I now feel even I can help people living in America!!”
Earlier this year, the cohort released their three principles for engaging communities, and now we’re excited to announce the launch of the Grant Content Kit, which will enable these organizations to more quickly apply for funding. CA: We created a tool called Grants Content Kit.
Restricted funds are donations or grants that can only be used for the purposes specified by the funder. Many grants, especially federal and state grants, are restricted. So, the organizations behind the grants use the reporting requirements to make sure the funds go towards addressing those impact areas.
Approval workflows that automatically enforce compliance Grants are the backbone of many community health centers. A fund accounting system with a segmented chart of accounts enables you to build systemic controls into each specific grant to ensure any booked financial activity is compliant with available budgets and contract restrictions.
private and community foundations to share information about their grant payments and grantmaking practices. Giving in 2023 by survey respondents remained about the same Among 496 respondents, cumulative grant dollars increased from $25.8 more grant dollars in 2023, and the median corporate foundation gave 1% more.
You can search and visualize media funding by the following: Show Grants By : Explore data for funders (blue) or recipients (orange). More Filters and Advanced Search: Tailor your search by funder type, grant amount, population served, keyword and more. List: View and sort foundation, recipients and grants data in table form.
James and Oliver will be live on the December Chart Chat. As a data professional, working at Tableau, it's easy sometimes to take data for granted. I interviewed Tim for an episode of If Data Could Talk , and he joined my co-hosts for a geeky dive into his favorite charts on Chart Chat. Living in Data. Note: in the U.S.,
HathiTrust, a unanimous three-judge panel concluded that digitizing books in order to enhance research and provide access to individuals with print disabilities is lawful on the grounds of fair use —that is, a limitation and exception to the exclusive rights granted by copyright law to the author of a creative work ( Section 107 of the U.S.
Consider the digital cybersecurity course to make sure the organization is inoculated from the most common (and damaging hacks) Start at the top of the marketing funnel (steal this chart). Steal this chart and use it to frame where your digital work/investments are going.
But without the right systems in place, administrative tasks like pulling grant reporting can be time-intensive and error-prone. From fundraising initiatives to grant awards, your food bank likely juggles a mix of restricted and unrestricted dollars. Reduce risk with a single source of truth for all your grant funding.
Grant Eisenmenger , InterWorks. How to Create a Variation Chart. How to Build a Rank Chart in Tableau? Charting Project Flow via Multiple Data Densifications. Bar in Bar Chart and Reference Line (Part 2). My Top Five Tableau Prep Solutions. Beth Kairys , InterWorks. Row-Level Security Basics in Tableau.
We organize all of the trending information in your field so you don't have to. Join 12,000+ users and stay up to date on the latest articles your peers are reading.
You know about us, now we want to get to know you!
Let's personalize your content
Let's get even more personalized
We recognize your account from another site in our network, please click 'Send Email' below to continue with verifying your account and setting a password.


Let's personalize your content