This site uses cookies to improve your experience. To help us insure we adhere to various privacy regulations, please select your country/region of residence. If you do not select a country, we will assume you are from the United States. Select your Cookie Settings or view our Privacy Policy and Terms of Use.
Cookie Settings
Cookies and similar technologies are used on this website for proper function of the website, for tracking performance analytics and for marketing purposes. We and some of our third-party providers may use cookie data for various purposes. Please review the cookie settings below and choose your preference.
Used for the proper function of the website
Used for monitoring website traffic and interactions
Cookie Settings
Cookies and similar technologies are used on this website for proper function of the website, for tracking performance analytics and for marketing purposes. We and some of our third-party providers may use cookie data for various purposes. Please review the cookie settings below and choose your preference.
Strictly Necessary: Used for the proper function of the website
Performance/Analytics: Used for monitoring website traffic and interactions
The Government of Alberta published the Alberta Nonprofit Listing Dashboard, which improves the accessibility of data, information and analytics about Albertas nonprofit sector using the official records of the Alberta Corporate Registry.
The Australian Broadcast Company’s ABC News app shot to the top of Apple’s App Store charts in Australia over the course of the last few days, not long after Facebook banned Australian news sources on its platform. 1 in the news app charts. Image: ABC News. ABC News currently sits at No. it became the most downloaded app in Australia.
According to a report from The Guardian , the company has removed a Facebook group with more than 1 million members after it was threatened by the Thai government for violating local laws around defaming the ruling monarch. Facebook restricted the group to avoid fines from the Thai government.
Strategy: Charting the Course to Thrive A well-crafted strategy isnt just a planits the compass that guides your association toward sustainable success. Our 2024 Digital Trends Survey reveals that organizations that integrate these elements are better positioned to navigate uncertainty and seize opportunities in an era of transformation.
Using a fund accounting system with a segmented chart of accounts requires fewer clicks and selections to track an expense, which reduces the potential for errors and helps to ensure your data integrity. And, of course, if you earned a government grant, the reporting can be even more complex.
They simplify complex information and help nonprofit and government organizations to engage, educate, and inform the public of the great work they do in their communities! You can create a simple infographic by doing such things as using minimal colors and making simple charts.
As a government agency, your team is used to doing more with less. Fund accounting software provides government agencies with the organization they need to track hundreds of funds while also establishing the internal controls and transparency required when stewarding constituent money. What is Government Fund Accounting Software?
The former head of trust and safety at Twitter has warned the platform now known as X is charting a collision course with the European Union’s rebooted digital rulebook, the Digital Services Act (DSA) — which carries penalties of up to 6% of global annual turnover for confirmed breaches of the online governance regime.
A mission-based rubric can govern policies and rules, specifying what actions to take when risks are detected. Only 15% of respondents reported visibility into second- and third-tier suppliers. Businesses need value-driven policies and systems in place to enforce them across the supply chain.
Chart the Course. The six simple stages to successful campaign planning are: Define the Victory. Evaluate the Campaign Climate. Choose Your Influence Strategy. Message for Impact. Manage the Campaign.
Ateken Abla November 14, 2023 - 6:59pm Sue Kraemer Senior Data Skills Curriculum Strategy Manager, Tableau Charts are all around us. When viewing and creating charts, it’s vital that we gain the ability to critically explore and discern the integrity of the information and conclusions shown in charts. Don’t be SCAM’d!
You can take a look at DappRadar’s NFT marketplace data set here , a related list of numbers from NonFungible here , and some great charted data from The Block here , if you want to dive in on your own. Did LooksRare suddenly surge to the top of the charts thanks to a better model, price list or other business effort?
This is a three part blog series in partnership with Amazon Web Services describing the essential components to build, govern, and trust AI systems: People , Process and Technology. This is the final post in a three part series that describes what is needed for companies to properly govern and ultimately trust their AI systems.
There's so much money to be made on the platform — brand deals, chart-topping songs, major e-commerce — but its trends are so difficult to foresee. government paying to have a McDonald's in the building responsible for maintaining its empire. If you could easily predict TikTok trends, I suspect you'd be spectacularly rich.
Chart: Apple Stocks. Chart: Apple Stocks. Some, like Dutch student Evan Oosterink, are counting on it — he bet about $10,000, which represented “years of savings from his parents and some government college loans,” The Washington Post reported. GameStop’s stock over the past week, with a big ‘ol dip today.
Track 1: Data Hits the High Notes Leading the charts this year was the star of the showdata! Bonus tracks included actionable insights on data governance and how to unlock the true power of their dataits like giving your old playlist a brand-new beat. So, grab your metaphorical headphones, and lets dive into our top tracks of 2024!
Have you ever wondered if there was a way to gauge and chart your user’s behaviors while they’re on your WordPress website? Indeed, armed with this information someone can gain valuable insights into usability issues that can then govern what changes one makes to the site to best optimize the visitor experience.
We’re just about a month away from TC Sessions: Space 2020 , a two-day conference dedicated to bold visionaries with the passion, audacity and technical skills to chart a new course in space. Fun fact: A bold visionary likes a good deal as much as the next one. But timing is everything. Check out the event agenda to strategize your schedule.
Interactive and dynamic charts will support a new visual vocabulary for your organization, allowing you to analyze data relationships around correlation, distribution, magnitude, rank, deviation, and change over time. This level of commitment starts at the top but also needs to be rooted in the organization’s structure. .
The same 6 or 7 competencies (see chart above) were selected as most important for all levels. Two recent research studies take a pass at answering that questions and the findings should be useful to those mentoring emerging leaders in their organizations and looking for professional development opportunities for them. “
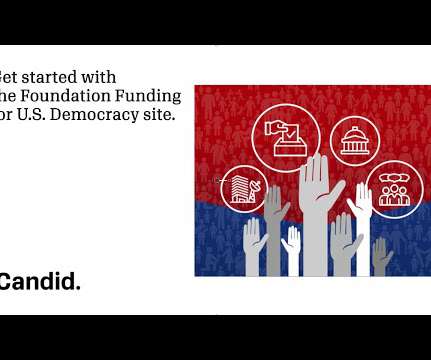
The data visualization tool, which consists of a map, charts, and lists, documents foundation support across several key areas including: campaign and election processes governing institutions and processes information and media public engagement and voting . democracy-related issues from 2011 onward. democracy.
Eric says that the term being “driven” implies — “going out of your way to devalue experience, ignore process, and eschew established governance in favor of a new, entirely metrics-powered approach towards decision making. &#. He suggests a new term, “data informed.&#.
While there might be less regulatory or governance pressure hanging over this aspect of your yearly financial reporting, it’s important for your organization to have an annual report that attracts donors, inspires confidence in leadership, and demonstrates transparency. Or do they want raw data for creating the pie chart themselves?
Data.gov: Data.gov provides public access to datasets generated by the Federal Government. You can filter the raw data, RSS feeds of the data, charts, maps, or even widgets made of the data. The site hosts a wealth of data searchable by agency, category, topic, or geographically.
In other words, you need to get your money from many different sources, not just one awesome foundation, one government grant, or one generous donor. If you rely solely on a government grant, what happens when the agency changes its eligibility criteria and you no longer qualify? Make a pie chart of your funding sources.
Why is it, when the list of committees is passed around and board members are asked to volunteer, few it any excitedly stick up their hands to work on governance? Although policies and best practices ARE an important part of what a governance committee works with, it’s just not fair to say the work is a drag.
If a government regulation changed or community preferences shifted, would you have time to react? Make Sure You’re Ready for Your Next Government Grant Government grants are a great addition to any nonprofit’s balance sheet. Tip 1: Before applying for a government grant, perform a financial integrity risk assessment.
These grants typically have goals associated with them—the foundation has a specific mission, or the government grant wants to address a specific societal issue. It also simplifies your account string, making your chart of accounts more streamlined and easier to understand.
Define your data vision Mission-driven organizations—nonprofits and government agencies like yours—are under ever-increasing pressure to demonstrate their impact. Successful data governance makes managing your data repeatable and can provide an organization with the support they need to grow sustainably.
We offer discounts for groups, students and current employees in government, the military and nonprofits. Nothing moves faster than tech, and keeping pace won’t chart a flightpath to success. Purchase your ticket ($125) before the early-bird launch window closes on 11.13.20 at 11:59 p.m. PST and keep $100 in your wallet.
Chart: US Treasury. The oldest variant on this chart started in 2018, but the data FinCEN analyzed goes back to 2011. The government has been working to clamp down on this vicious cycle, though. One of the most shocking numbers in the report is that the top 10 hacking groups have trafficked around $5.2
foundations in a given year (see chart below). Why we use the Foundation 1000 sets for trends analysis As illustrated in the chart above, the Foundation 1000s’ grantmaking is much more stable over time compared to the broader grant data set. private and community foundations. private and community foundations. Pledges are excluded.
Charity, business, and government, all accomplish great things but have their limitations. And lastly, government. We know that government is rightly tackling many problems for our common good. But innovation is difficult in government because of the constraints that government often operates under. First, charity.
One key surprise in 2021 was the fact that despite a regulatory barrage from the central government , Chinese startups had a pretty good year when it came to raising capital. I have never seen a chart quite like this one: Image Credits : YCharts. You would have been forgiven for expecting the opposite.
As an independent agency of the Government, their work engages over 5 million people in service across AmeriCorps VISTA , AmeriCorps NCCC , AmeriCorps State and National, and AmeriCorps Seniors. Steal this chart and use it to frame where your digital work/investments are going.
And so, instead of having uniform, machine-oriented data, we got a massive increase in the variety of data and data types and a decrease in data governance. There are some situations where you can Google for a quantitative question and get back a little table or chart, but that’s only if you ask just the right questions.
According to Jitasa , this software should be able to: Organize various types of transaction records in a concise chart of accounts. Plus, like all organizations, nonprofits need to adhere to the rules set forth by the Financial Accounting Standards Board (FASB) , the independent governing body of financial reporting in the United States.
Since Tableau's first release in 2004, all visualizations created inside Worksheets have been rendered using VizQL , a breakthrough technology that allows you to create a chart with a simple drag-and-drop. Shipping sankey chart by Tristan Guillevin. Say hello to complex charts, as easy as drag and drop. What are Viz Extensions?
Mayopoulos, the former CEO and executive at Fannie Mae, said that the future of the bank is still being charted out, but added that depositors’ actions will impact these decisions. This is not a risky thing we’re asking you to do,” Mayopoulos said during the call. A relationship between SVB in the U.S.
With your help, we’ve amassed a wealth of current information on demand for services, trends in government support, board participation, and financial health. The chart below highlights that upward trend. This increase in demand is coupled with unreliable and insufficient funding, particularly from the government.
The Government of Canada has rallied behind nonprofits with its historic Community Services Recovery Fund. Indigenous Governing Bodies: Indigenous Governing Bodies that are not registered as nonprofits or as qualified donees, ex. First Nations bands. Systems and Processes, apply to Community Foundations of Canada (CFC).
Much like a developing human, our data collections have gotten bigger over time (see chart below), undergone developmental changes, and experienced the associated growing pains. government agencies ii. government agencies is sourced from usaspending.gov and was retroactively added to the data going back to 2014.
Employees need to participate in establishing goals , plans, and governance, especially at the outset. Greg Perlstein is a digital transformation lead for Salesforce.org, working with customers to chart their paths to greater social impact. That’s not to say transformation happens without people. About the Author. Greg Perlstein.
Whether you’re appealing to the government, private organizations, individual investors, or charitable donation services, every grant proposal should include the following: Cover letter. Feel free to use graphs, charts, tables, timelines, and any other means to convey your thoughts in a clear and meaningful manner. Executive summary.
We organize all of the trending information in your field so you don't have to. Join 12,000+ users and stay up to date on the latest articles your peers are reading.
You know about us, now we want to get to know you!
Let's personalize your content
Let's get even more personalized
We recognize your account from another site in our network, please click 'Send Email' below to continue with verifying your account and setting a password.


Let's personalize your content