This site uses cookies to improve your experience. To help us insure we adhere to various privacy regulations, please select your country/region of residence. If you do not select a country, we will assume you are from the United States. Select your Cookie Settings or view our Privacy Policy and Terms of Use.
Cookie Settings
Cookies and similar technologies are used on this website for proper function of the website, for tracking performance analytics and for marketing purposes. We and some of our third-party providers may use cookie data for various purposes. Please review the cookie settings below and choose your preference.
Used for the proper function of the website
Used for monitoring website traffic and interactions
Cookie Settings
Cookies and similar technologies are used on this website for proper function of the website, for tracking performance analytics and for marketing purposes. We and some of our third-party providers may use cookie data for various purposes. Please review the cookie settings below and choose your preference.
Strictly Necessary: Used for the proper function of the website
Performance/Analytics: Used for monitoring website traffic and interactions
Beth’s blog shares Ann Emry’s tips for creating charts with your nonprofit’s data. Charts can turn plain text into a visually, expressive piece of information, which is great for persuading donors to donate or showing your supporters your organization’s impact. Chart diversity. Showcase data.
But being a nonprofit data is not just about being an Excel ninja, it is also about visualizing data and being a chart master. When Ann told me she has lots of secrets and time saving tips for charts and offered to write this guest post, I was thrilled. Charts can be one of your strongest communication tools.
It is ubiquitous in our digital life in the form of iconography, infographics, tables, plots, and charts, extending to the real world in street signs, comic books, food labels, etc. For that reason, having computers better understand this type of media can help with scientific communication and discovery, accessibility, and data transparency.
.” Stephen Few, data visualization expert On a single day, Facebook users share 2.45 The competition for eyeballs is fierce, but data visualization offers a way to stand out. The competition for eyeballs is fierce, but data visualization offers a way to stand out. Why is data visualization so effective?
and provided the two possible responses of “friends&# or “data&# – I used the question style where respondents had to pick one answer or the other exclusively. And once all 100 responses were gathered, I took a look at all the data. First, overall: And when you click on “What does this chart mean?&#
Now the startup is mapping out a new expansion strategy after landing $22 million in Series B funding, which it will use to improve its current tech and add new features. It makes mapping drones, develops software for fully autonomous flights and the WingtraPilot app, which collects and processes aerial survey data.
Nonprofit data nerds will love this new resource from Media Impact Funders and Foundation Center called “ Foundation Maps for Media Funding ,” a free, interactive mapping and research tool that shows the full scope of philanthropically funded media projects worldwide since 2009. Click to See Visualization.
I wanted to take a deeper dive into resources out there that provide useful tips about how to do this step for folks who were not data scientists or data nerds. 1) Data Visualization Survival Guide : This resource (including the 176 slides powerpoint deck) was suggested by Devon Smith. How do you tell stories with data? (3)
Andy Cotgreave—dataIQ Top 100 in data 2021, author of Big Book of Dashboards and Tableau technical evangelist—shares his top data-related books from this year. Nor that it displays myriad approaches to what a map can be. James and Oliver will be live on the December Chart Chat. Living in Data. Kristin Adderson.
Spencer Czapiewski August 6, 2024 - 6:34pm Kyle Massey VP Lead Software Engineer Kyle Massey, a two-time Tableau DataDev Ambassador and co-leader of the DataPride Tableau User Group, shares his experience with VizQL Data Service. What is VizQL Data Service? Why should you be excited about VizQL Data Service?
Have you ever wondered if there was a way to gauge and chart your user’s behaviors while they’re on your WordPress website? Essentially, the tools and programs for creating a heat-map build an “overlay” of your various site’s pages, and areas that attract more activity appear “hotter” than sections that experience low activity.
The same principle lies at the heart of a mind map. Mind maps help us stay organized in the world of content shock, informational chaos, and short attention span. They say mind mapping makes people more creative and retentive. Why use mind maps in your nonprofit practice? Mind maps can help you: Plan nonprofit projects.
TweepsMap is an interesting Twitter app that will put your followers on a map of the world, literally. Despite a few glitches, you use this tool to see if your audience is local or global. What did you discover by putting your Twitter followers on the map?
Andy Cotgreave—dataIQ Top 100 in data 2021, author of Big Book of Dashboards and Tableau technical evangelist—shares his top data-related books from this year. Nor that it displays myriad approaches to what a map can be. James and Oliver will be live on the December Chart Chat. Living in Data. Kristin Adderson.
In grantmaking, one word makes more eyes glaze over than any other – data. With one shift in our understanding about data, we can reclaim a sense of wonder, creative agency, and value in our data work: Recognizing that information does not equal data and data does not equal knowledge.
Who needs a crystal ball when you have data? The role of a Chief Financial Officer has always been to use data to tell the story of your organization’s past, present, and future. CFO job duties generally include overseeing the finance team, analyzing and presenting financial statements, and budgeting and forecasting.
We've covered bar charts, line charts, scatter plots, and maps in Beyond the Pie Chart. We finish the series by explaining the only time a pie chart actually is the right choice. When to Use a Pie Chart. As we state in our white paper, Which Chart or Graph is Right for You? Overlay pies on maps.
He has some terrific advice about how to apply visual thinking to your data visualization and to get insights. But first, he simplifies what visual thinking is: Look, See, Imagine, and Show. These are a great set of questions to ask as you look over your data. The steps are: Collect your data. Map the data.
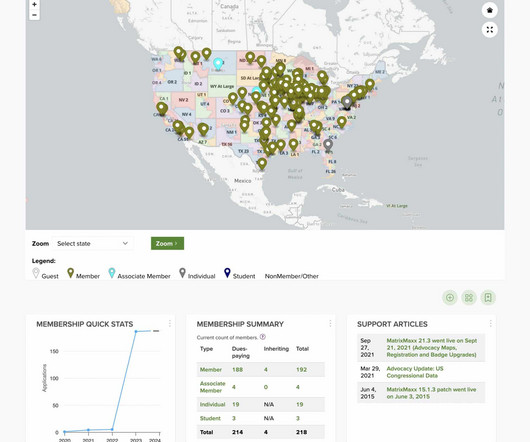
of MatrixMaxx , a leading Association Management System (AMS) that helps trade associations and professional societies manage their organizations better, have great member journeys, and be higher performing through data. These highly visual dashboard elements will give staff a new perspective on membership data and trends.
Scientist / Data Analysis Engineer / General Techie Want to help save the world with your code? We're Benetech's Human Rights Data Analysis Group, and we're hiring right now ! What you will do: Write computer programs for human rights data analysis projects. Process, clean, and transform data.
In service of this, in this blog, we’re highlighting five things we’ve heard about our grants data that aren’t quite accurate. Myth 1: “Candid grants data” is the same as “990 data.” These forms are a primary source of data about U.S. These forms are a primary source of data about U.S. Many of the largest U.S.
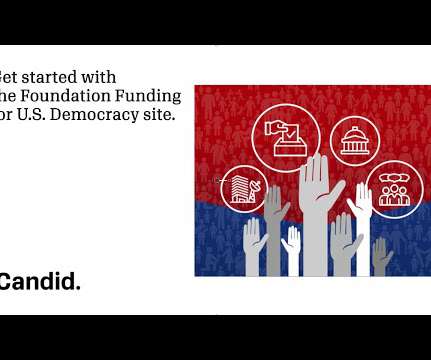
The data visualization tool, which consists of a map, charts, and lists, documents foundation support across several key areas including: campaign and election processes governing institutions and processes information and media public engagement and voting . Democracy website is a great resource to help you get started.
. —– I love data as much as the next person. Give me an interactive map, a pivot table, even a plain old pie chart and I’m happy. But, there’s more to being data-informed and more to what we should demand of our data, right? Is data helpful if you aren’t using it? data nten'
Nonprofits everywhere are struggling to get their hands on reliable, useful workplace giving data from corporate giving programs. Who remembers the days of charities arguing with local United Ways over the donor data? Too many sources of donor data to keep track of. The data generated by the workplace has changed.
Fitbit activity analysis with DuckDB Photo by Jake Hills on Unsplash Wearable fitness trackers have become an integral part of our lives, collecting and tracking data about our daily activities, sleep patterns, location, heart rate, and much more. What insights are buried within my archive of personal fitness activity data?
By Kurt Voelker, CTO, Forum One Data is the new black. Data is so much more than a stack of numbers or a server filled with client outputs. One effective way to transform your data from an afterthought into a powerful communications product is through visualizations that help tell your story. And for good reason.
Websites are loaded with eye candy these days — from slick user interfaces to interactive maps to cool photo slideshows — all achieved without Flash, just HTML, CSS and Javascript. In this 2-part series, I'm going to focus on the rapidly changing world of interactive tools for data visualization, or dataviz.
For health data to impact health outcomes and related policies, the data must be made accessible to policymakers, health advocates, and other interested parties. Too often, health data is locked in massive datasets that are opaque to all but epidemiologists and statisticians.
Charts and graphs are useful, but when you have any kind of location data — whether it's postal codes, state abbreviations, country names, or your own custom geocoding — you've got to see your data on a map. So demand the same informative view from your data. When to Use Maps.
Data sharing has become a critical part of collaboration and will continue to do so as we are able to access and create more data. There are many sites that allow you to upload data, as well as download other data, for free. The site hosts a wealth of data searchable by agency, category, topic, or geographically.
Oxfam in Haiti – Google Maps – This is a great example of how you can use a tool like Google Maps to tell a story and provide easy access to information – great job Oxfam! "Oxfam This map shows some of the sites where Oxfam is providing water and sanitation, as well as employment through the cash-for-work program.
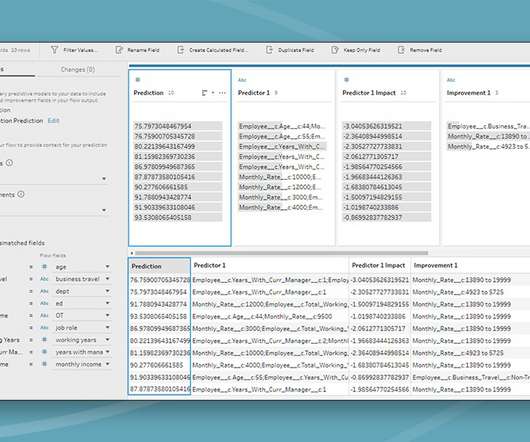
In the April release of Tableau Prep, you can now invoke the power of Salesforce Einstein Discovery to bulk score your data directly in your flow. With this integration, you can apply predictive machine learning models built in Einstein Discovery to your flow data, then generate predicted outcomes directly in your flow. April 7, 2021.
Data Culture, Blueprint. Katie Kilroy , Data Katie. Data Doctor Download: The Advice Column No One Asked For. Map Layers, Buffer Calculations & Parameter Actions in Tableau. Jason Penrod , Playfair Data. Hiding a Tableau Filter’s Options While Including Its Data. How to Make a Radar Chart in Tableau.
Three I’m excited about are Back 2 Viz Basics , Data Plus Music and Games Night Viz. Data viz Colors: The Good the Bad (and the Ugly). A Typology for Dashboard Insights: Contextual, Functional, and Strategic Data Points. Gabriela Mitache , The Data School UK. 5 Tips to Visually Enhance your Tableau Data Visualizations.
Whether you have a blog, website, or even multiple, you can use Google Analytics to really drill down into the data and understand how people are visiting and using your site. Community Mapping. Then, for each group, create a chart with 4 columns and identify: Their goal: why do they engage with you.
Nine months after its public launch, Verb Data , a customer-facing analytics company, took in $3 million in funding to continue developing technology so that SaaS companies can build better in-product dashboards for their customers. Users will also be able to visualize their data on maps on existing dashboards to allow for better reporting.
The first of these free webinars, Mapping Philanthropy: How You Can Use Data Visualization to Do Good , will be held on Thursday, March 29 at 11 a.m. At the Foundation Center, he builds mapping applications, data visualizations, semantic analysis scripts, and application programming interfaces (APIs). Pacific time.
Read on to discover the value of data-driven storytelling and how this key feature increases trust and enables your nonprofit to drive more revenue. By applying simple information-sharing strategies, you can appeal to donors who, in today’s dynamic world, are more sophisticated and demand data when deciding how to allocate funds for donation.
In Zambia’s North Luangwa National Park, rangers study the map on their screen to see if there are any places they haven’t checked. Fed by data compiled from EarthRanger, a wildlife management and protection tool, the rangers discover an area unchecked. Park rangers becoming data pioneers. Photo: Mana Meadows.
As a Database Administrator, my world revolves around helping users make sense of the information they receive, from voice-of-the-customer anecdotes and impressions to polished Key Performance Indicator (KPI) graphs, charts, and dashboards. Why pay attention to data? Data is valuable! Data fuels most activities in a nonprofit.
There is no “I” in data. No one team or person can handle all the data in a given organization, so how do you get everyone to pull together and gain alignment? Unifying your data strategy is not an easy task. What’s in your data vision? The systems and tools that both produce and use data just keep on multiplying.
The first webinar in this series, Mapping Philanthropy: How You Can Use Data Visualization to Do Good , was held on March 29. Data Visualization Goals. One theme that I took away from this webinar was the need to identify a goal for data visualizations. This free event will be held on Thursday, April 26 at 11 a.m.
Similar to the advancements in telescope technology, data visualizations 10 years ago were no where near the art they’ve become today. Vizzes advance as the industry learns more about accessibility and human cognition, and as improved data literacy pushes the world to be more data driven. Go TEAM DATA! Darragh Murray.
We organize all of the trending information in your field so you don't have to. Join 12,000+ users and stay up to date on the latest articles your peers are reading.
You know about us, now we want to get to know you!
Let's personalize your content
Let's get even more personalized
We recognize your account from another site in our network, please click 'Send Email' below to continue with verifying your account and setting a password.


Let's personalize your content