This site uses cookies to improve your experience. To help us insure we adhere to various privacy regulations, please select your country/region of residence. If you do not select a country, we will assume you are from the United States. Select your Cookie Settings or view our Privacy Policy and Terms of Use.
Cookie Settings
Cookies and similar technologies are used on this website for proper function of the website, for tracking performance analytics and for marketing purposes. We and some of our third-party providers may use cookie data for various purposes. Please review the cookie settings below and choose your preference.
Used for the proper function of the website
Used for monitoring website traffic and interactions
Cookie Settings
Cookies and similar technologies are used on this website for proper function of the website, for tracking performance analytics and for marketing purposes. We and some of our third-party providers may use cookie data for various purposes. Please review the cookie settings below and choose your preference.
Strictly Necessary: Used for the proper function of the website
Performance/Analytics: Used for monitoring website traffic and interactions
The Millennial Donor report uncovered that celebrity is the bottom of the charts: When asked to describe what motivates them to give, 85% of Millennials pointed to a compelling mission or cause, and 56% cited a personal connection or trust in the leadership of the organization. But, on the top of the chart: a compelling cause.
The mix of design with storytelling is well balanced; the story [they’re] telling is very clear and so we have charts that are easy to read … Any decisions to go off the beaten track feel like they've been made with intent,” - An excerpt from my judge’s feedback on one of the winning #Viz4ClimateAction entries. Radial Column Chart.
The mix of design with storytelling is well balanced; the story [they’re] telling is very clear and so we have charts that are easy to read … Any decisions to go off the beaten track feel like they've been made with intent.” . — Beyond that, contests provide interesting challenges in how to provide feedback. Radial Column Chart.
Beautiful Business Dashboards: The How and the Why : Samuel Parsons and Simon Beaumont are masters at their craft, and it was so cool to see how these two took ordinary charts and made them absolutely beautiful, sharing some tips and tricks along the way. Let’s build a trellis chart! And finally, much to my delight … the main event.
Beautiful Business Dashboards: The How and the Why : Samuel Parsons and Simon Beaumont are masters at their craft, and it was so cool to see how these two took ordinary charts and made them absolutely beautiful, sharing some tips and tricks along the way. Let’s build a trellis chart! And finally, much to my delight … the main event.
Three fierce contestants took the keynote stage to rock day two with their mad data storytelling skills. Working alongside each contestant was their study buddy, trusted advisor, and fiercest cheerleader, their Sous Vizzer. He included a violin chart showing distributions of numeric data for one or more groups using density curves.
Three fierce contestants took the keynote stage to rock day two with their mad data storytelling skills. Working alongside each contestant was their study buddy, trusted advisor, and fiercest cheerleader, their Sous Vizzer. He included a violin chart showing distributions of numeric data for one or more groups using density curves.
Three fierce contestants took the virtual stage to rock day two with some visualization madness. The judges' score made up 90% of each contestant's total score, while the audience weighed in with the remaining 10% of the votes via text. What an outstanding performance and dazzling display of data from all the contestants!
Three fierce contestants took the virtual stage to rock day two with some visualization madness. The judges' score made up 90% of each contestant's total score, while the audience weighed in with the remaining 10% of the votes via text. What an outstanding performance and dazzling display of data from all the contestants!
Iron Viz is the world’s largest data viz competition, where every year, three contestants, selected from hundreds in a global qualifier competition, visualize the same data set in 20 minutes center stage at Tableau Conference. The prior tools I have used have pre-selected chart types. It’s a journey of discovery.”
This chart comes from Chapter 5 of Measuring the Networked Nonprofit where we discuss how to measure outcomes from social media versus activities. It is about how social media (and other digital tools I might add) help an organization move towards longer-term outcomes in their theory of change or articulated goals.
Themes for Viz Games are typically around a particular topic, dataset, business problem, chart/dashboard type, or feature. Three worthy contestants selected from the Tableau Community global qualifier competition take center stage. It is important to be creative and challenge the participants in a fun and engaging way.
Themes for Viz Games are typically around a particular topic, dataset, business problem, chart/dashboard type, or feature. Three worthy contestants selected from the Tableau Community global qualifier competition take center stage. It is important to be creative and challenge the participants in a fun and engaging way.
Connecting these understandings with the fact that texting is still the most engaged activity on a mobile device (see ComScore and eMarketer 2012 chart below) and it doesn’t take long before a compelling marketing opportunity presents itself, one that still finds itself far too under-utilized by the brands we know and love. .
Along with 3 colleagues, we volunteered to develop an entry for the Apps for America 2 contest , sponsored by the Sunlight Foundation. Over 1,500 mashups later, and a first prize win in the contest, DataMasher is proving to be a great experiment in data transparency. Because data is powerful! Fortunately, simply choosing Save As.
Oftentimes with other applications, data needs to be prepped before it can be converted into visual form (such as a graph or chart), whether that means adding a column, combining data sets, inserting a new formula, or the like. website along with a contest aimed at new and nontechnical users. The exact opposite is true. Eastern time.
Blog commenters are contributors, as are people who engage in contests. Here’s a chart that may help you figure out what type is best for your next project. While there are outlier innovative projects that defy categorization, this chart displays the fundamental characteristics of each model. .
t want content pushed to them, particularly contests or other promotional programs that don???t As the chart above details, people who join Facebook Pages fall into three different profiles. It makes this point: Although many users have joined brand pages advocating various messages, the average Facebook user doesn???t
During this hour, the Foundation Center's George Ford and Jake Garcia will take a look at how grant seekers can use the interactive maps and charts in Foundation Directory Online , the Foundation Center’s grant seeking database for nonprofits, to identify prospective funders. Register for the webinar here.
Check out the winners of SlideRocket's Nonprofit Presentation Contest for great examples. You can also use Visio 2013 to make dynamic diagrams and charts for your story. SAP Crystal Reports : Make your charts and yearly reports jump off the page when you make them interactive and animated with SAP Crystal Reports.
We haven’t launched a major social media campaign since our brainstorming session but are planning to develop a measurement pilot the next time we execute our semi-annual cartoon caption contest or a Facebook campaign involving one of our legal cases. What advice would you give to others?
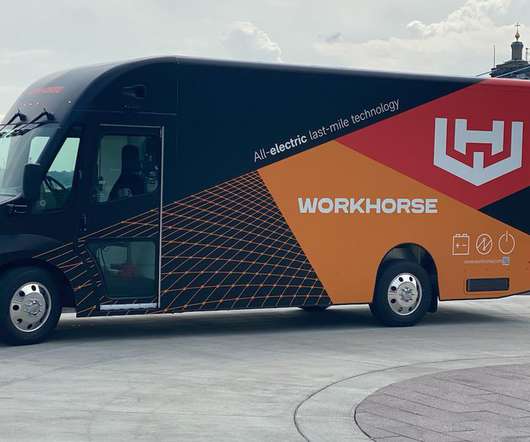
And he said it would be up to them (and him) to rebuild Workhorse’s supply chain, retain customers while courting new ones, and chart a new course for the company’s products. Workhorse was spending “a hell of a lot of money” on outside consultants, legal firms, and lobbying groups, Dauch said.
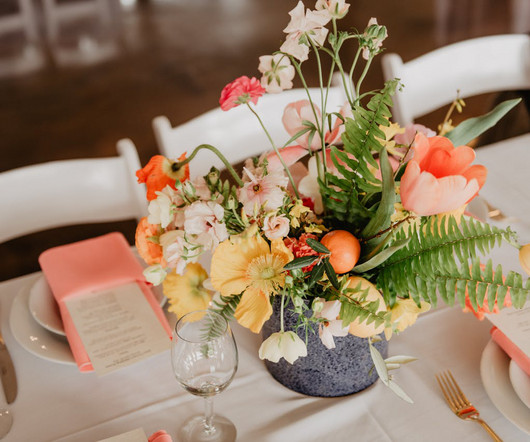
These challenges could range from a trivia contest to a fun dance-off or relay races. Or you can curate a playlist that includes a mix of classic hits and the latest chart-toppers to cater to all tastes. Encourage guests to hit the floor by providing dance lessons or fun contests throughout the evening.
Even ArtPrize , the "radically open" art festival that was judged last year by public vote alone, will incorporate a juried contest as well this year. One prototype is based on the Billboard Top 10 charts for pop music. Every week, Billboard publishes charts based on airplay, record sales, and now, digital downloads and streaming.
For example, an animal shelter may host a dog costume contest where supporters make a donation to vote for their favorite pup. . Jay and his team grew the company to more than 10,000 nonprofit clients, charting a decade of record growth. For example, you can build your year-end fundraising celebrations around: . Thanksgiving.
Themes for Viz Games are typically around a particular topic, dataset, business problem, chart/dashboard type, or feature. Three worthy contestants selected from the Tableau Community global qualifier competition take center stage. It is important to be creative and challenge the participants in a fun and engaging way.
TechSoup organizes an annual event called Storymakers ; organizations from around the globe participate in a multimedia contest for a chance to win exciting prizes and learn how to effectively tell their story. Read more › Step 2: Setting Up the Chart of Accounts. Storymakers. Our Digital Storytelling Challenge.
Our Storymakers campaign offered storytelling how-to webinars and events, culminating in a contest to identify the very best nonprofit videos. Learn how to plan and implement QuickBooks, how to set up the chart of accounts , master coding and reporting , and more. Refresh it with these 10 tips for creating captivating websites.
We are just weeks away from Tableau Conference and the ultimate visualization showdown —Iron Viz 2021—where three fierce contestants will take the virtual stage for an intense lightning round of live viz-tastic storytelling. . Tell us what you're most excited about and who you're rooting for throughout the contest using #IronViz on Twitter.
We are just weeks away from Tableau Conference and the ultimate visualization showdown —Iron Viz 2021—where three fierce contestants will take the virtual stage for an intense lightning round of live viz-tastic storytelling. . Tell us what you're most excited about and who you're rooting for throughout the contest using #IronViz on Twitter.
The secret of reality TV’s success is the viewer’s involvement with the ‘journey’ of the contestants. Each Monday morning we counted up the votes cast during the previous week and on Wednesday, the museum released a new Top 40 chart. A fairly large label with this week’s chart position was placed next to each artwork.
Host a team contest – whoever recruits the most members by the end of the week wins a prize! Take a moment and chart out your communication plan for each audience. Keep an eye on these metrics each week, so you can correct your communications and tactics as needed. Are teams down? Is fundraising slow to pick up?
Host a social media contest where followers can guess the total value of the basket, with the winner receiving a free raffle ticket for the auction. Travel packages are silent auction powerhouses, consistently leading the charts. Travel Packages If you have the budget, travel packages can attract a large crowd to your auction.
They defined data visualization as the representation of information in the form of a chart, diagram, or picture. There are many options for peer-to-peer fundraising you can use: Contests Challenges Crowdfunding DIY fundraising A-thons (walk, bowl, etc.)
It would be more correct to compare it to data visualizations like tag clouds or spark charts. is not a popularity contest made to "give the people what they want". Both the New York Times and the Washington Post commented that the resulting show is not that visually impressive, but they are comparing Click! And that’s a good thing.
I'm very excited that our Datamasher web site is one of the three finalists in the Sunlight Foundation's " Apps for America 2 " Contest! Datamasher is a web site where anyone can "mash-up" two sets of Federal data about US States to create a custom indicator, which can then be viewed by all on a State-by-State map or chart.
Opera San Jose gave a presentation on its #operaplot hashtag contest where participants has to tweet the plots of operas in 140 characters. Everyone was given a piece of flip chart paper and magic markers when they arrived at the workshop. View more presentations. Some of the presentations focused on the tactics.
gold medalist in the decathlon: a two-day contest that includes 10 events encompassing running, jumping, and throwing events. The thing I like about decathlon is also the thing I dislike: It’s the maximum challenge, but also the maximum frustration. Ashton Eaton , U.S. Olympian decathlete Ashton Eaton is a two-time U.S.
But a friend of mine says it’s like trying to get into a urinating contest with Niagara Falls, right, you’re not going to win that one. . Steven: Yeah, standing out does seem to be the key because, like you said, everyone’s inbox are full of emails with the same subject line. . Andy: You know, I will use the nonvernacular.
Desperate for one last family-unifying road trip, her dad (Danny McBride) piles the whole family into his beater of a vehicle, unknowingly charting a fateful route into heroics. Luckily for Eurovision lovers, the contest gets the send-up it deserves in this gloriously goofy flick starring Will Ferrell and Rachel McAdams.
We organize all of the trending information in your field so you don't have to. Join 12,000+ users and stay up to date on the latest articles your peers are reading.
You know about us, now we want to get to know you!
Let's personalize your content
Let's get even more personalized
We recognize your account from another site in our network, please click 'Send Email' below to continue with verifying your account and setting a password.


Let's personalize your content