This site uses cookies to improve your experience. To help us insure we adhere to various privacy regulations, please select your country/region of residence. If you do not select a country, we will assume you are from the United States. Select your Cookie Settings or view our Privacy Policy and Terms of Use.
Cookie Settings
Cookies and similar technologies are used on this website for proper function of the website, for tracking performance analytics and for marketing purposes. We and some of our third-party providers may use cookie data for various purposes. Please review the cookie settings below and choose your preference.
Used for the proper function of the website
Used for monitoring website traffic and interactions
Cookie Settings
Cookies and similar technologies are used on this website for proper function of the website, for tracking performance analytics and for marketing purposes. We and some of our third-party providers may use cookie data for various purposes. Please review the cookie settings below and choose your preference.
Strictly Necessary: Used for the proper function of the website
Performance/Analytics: Used for monitoring website traffic and interactions
Staying current with the latest digital marketing and fundraising trends and benchmarks is essential for nonprofits. BenchmarksStudy 2024 :: Download [US] Published by M+R 2. 2024 Nonprofit Advertising BenchmarkStudy :: Download [US] Published by Whole Whale 8.
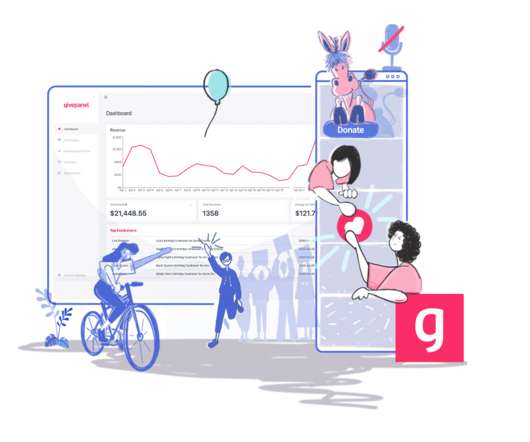
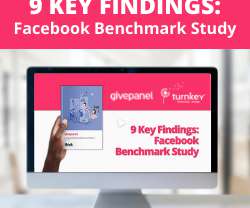
We’re going to review the Facebook Fundraising Benchmarks Report 2020 by GivePanel. Let’s clarify what “Facebook fundraising” refers to. It’s probably exactly what you think it is: when someone on Facebook starts a fundraiser to support your nonprofit. But there’s some fine print here.
Download the benchmarkstudy for an in-depth look at 157 GivePanel charities across the US, UK, and Ireland. Knowing the different types of fundraising and donations that can happen is a scary task. Check out our 9 Key Findings on Facebook Fundraising to help you get these difficult questions answered.
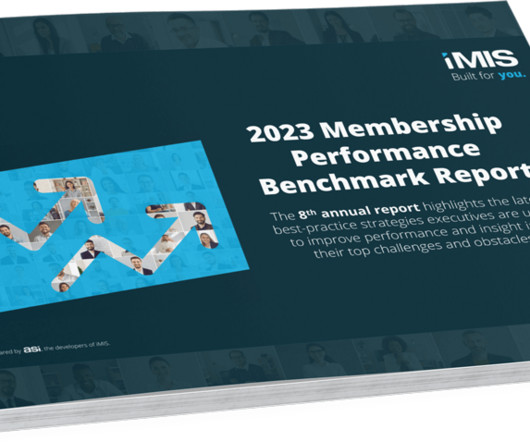
ASI has released the results of its global 2023 Membership Performance Benchmark Survey. The eigth annual survey, conducted in late 2022, examines membership trends, including recruiting, retention, and engagement.
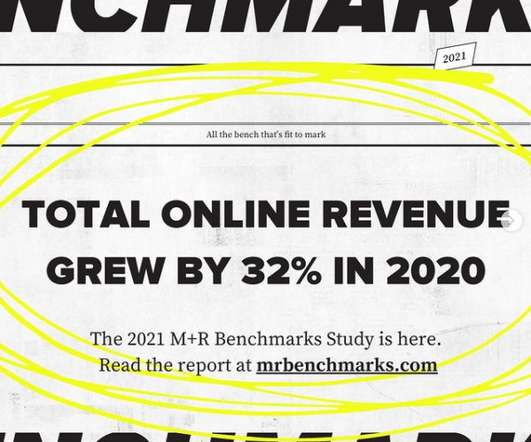
Shortly after the nonprofit sector learned that both overall donors and donor dollars had declined, M+R confirmed the downward trends with M+R Benchmarks 2023, noting a 4% median decline in year-over-year online revenue for nonprofits.
To view it please enter your password below: Password: The post Protected: 2024 Nonprofit Advertising BenchmarkStudy appeared first on Whole Whale. This content is password protected.
BenchmarksStudy 2022 :: Download. 2020 Multicultural & Newcomer Charitable Giving Study :: Download. Facebook Fundraising Benchmark Report 2022 :: Download. Benchmarks UK Study 2021 :: Download. If you would like to suggest a report be added to the list, please contact Heather Mansfield.
We are delighted to be able to share the 2025 M+R BenchmarksStudy with you. This years study includes metrics on email and mobile messaging, advertising, web traffic, social media and influencers, and more. About half of M+R Benchmarks participants reported working with social media influencers in 2024.
The annual M+R BenchmarksStudy is a tasty fusion of digital fundraising, advocacy, and marketing data. We hope you’ll join us and participate in our upcoming 2023 M+R Benchmarks. Again, we take measures to make sure that your organization’s data is confidential and non-identifiable in the final study.
The maître d’ has called your name, the table is set, and the napkins are folded up like fancy little swans: it’s time to dig in to a year’s worth of M+R Benchmarks charts, findings, and insights at mrbenchmarks.com ! The 2023 M+R BenchmarksStudy is served! Sign up for the webinar now. The post Come and get it!
We are excited to report that the 2021 M+R BenchmarksStudy is ready for you. Thanks to contributions from 220 amazing nonprofit participants, this year’s BenchmarksStudy covers detailed data including digital ads, social media, email, web traffic, mobile messaging, and more. . 2021 Benchmarks UK FAQ.
BenchmarksStudy 2020 :: Download. 2019 Email Deliverability BenchmarksStudy :: Download. 2020 Multicultural & Newcomer Charitable Giving Study :: Download. Published by the Giving USA Foundation. Published by M+R. Published by EveryAction. For Nonprofits in Canada: 1. The Giving Report 2020 :: Download.
Recent donorCentrics Sustainer Benchmarkingstudies show that some 6% of monthly donors will make at least one extra gift a year when asked, so not asking is definitely leaving money on the table. Here's how to go about it.
Pack your bags, lock your tray table, and fasten your seatbelt: the 2022 M+R BenchmarksStudy is ready for takeoff. The full 2022 BenchmarksStudy is waiting for you to explore right now (or download as a pdf so you can still check it out while in airplane mode). Sign up for the webinar now. .
Staying current with the latest digital marketing and fundraising trends and benchmarks is essential for nonprofits. BenchmarksStudy 2023 :: Download [US] Published by M+R 2. Communications Benchmark Report 2022 :: Download [UK] Published by the CharityComms 11.
BenchmarksStudy 2020 :: Download. 2019 Email Deliverability BenchmarksStudy :: Download. Published by the Lily Family School of Philanthropy. 2020 Nonprofit Trends Report :: Download. Published by Salesforce. Published by M+R. 2019 Charitable Giving Report :: Download. Published by the Blackbaud Institute.
Here it comes, hot off the presses: The 2021 M+R BenchmarksStudy will go live on Wednesday, April 21. We will be reporting the key findings and answering the biggest questions on a special Benchmarks release webinar on April 21 from 1:00–2:30PT/4:00–5:30ET. 2021 Benchmarks UK FAQ. Sign up for the webinar now. .
For Nonprofits in the United States: 1) 2012 eNonprofit BenchmarksStudy :: Download. 3) 2012 Nonprofit Social Networking Benchmark Report :: Download. 3) 2012 Nonprofit Social Networking Benchmark Report :: Download. 4) 2012 Online Marketing Nonprofit Benchmark™ Study :: Download. Published by NTEN.
For Nonprofits in the United States: 1) 2013 eNonprofit BenchmarksStudy :: Download. 4) 2013 Online Marketing Nonprofit Benchmark™ Study :: Download. 5) 2013 Benchmarks for Nonprofit Video :: Download. 7) 2012 mGive Text Giving Study :: Download. Published by M&R Research Labs.
2014 Nonprofit BenchmarksStudy :: Download. 2013 Online Marketing Nonprofit Benchmark™ Study :: Download. 2013 mGive Text Giving Study :: Download. For Nonprofits in the United States: 1. Published by M+R and NTEN. 2014 Charitable Giving Report :: Download. Published by Blackbaud. Published by Blackbaud.
1) 2012 Nonprofit Social Networking Benchmark Report :: Download. 2) 2012 Online Marketing Nonprofit Benchmark™ Study :: Download. 5) 2011 donorCentrics Internet and Multichannel Giving Benchmarking Report :: Download. All the reports currently listed are based on U.S. Thank you. Published by NTEN. Published by Convio.
Staying current with the latest digital marketing and fundraising trends and benchmarks is essential for nonprofits. BenchmarksStudy 2024 :: Download [US] Published by M+R 2.
Source: 2016 Luminate Online Benchmark Report. Source: 2016 Donor Loyalty Study. Source: 2017 BenchmarksStudy. Source: Dunham+Company. Sustainer income from monthly donors grew 10% in 2016. High-wealth donors ($200,000+ in annual household income) give an average of $2,252 annually and 51% prefer to give online.
For Nonprofits in the United States: 1) 2013 eNonprofit BenchmarksStudy :: Download. 4) 2013 Online Marketing Nonprofit Benchmark™ Study :: Download. 4) 2013 Online Marketing Nonprofit Benchmark™ Study :: Download. 6) 2013 Benchmarks for Nonprofit Video :: Download. Published by Blackbaud.
2017 BenchmarksStudy :: Download. 2017 Digital Member Study :: Download. 2017 Luminate Online Benchmark Report :: Download. Published by the Blackbaud Institute. Giving USA 2017 :: Download. Published by the Giving USA Foundation. Published by M+R and NTEN. Published by Community Brands. Published by Blackbaud.
2014 Nonprofit BenchmarksStudy :: Download. 2014 Online Benchmark Report :: Download. 2014 mGive Text Giving Study :: Download. 2013 Peer-to-Peer Fundraising Study :: Download. Most of the reports listed are based on U.S. For Nonprofits in the United States: 1. Published by M+R and NTEN.
Dialogue Health published the Health and Well-Being Report: A Canadian Benchmark. The study found that the overall well-being score for employees is still […] The post Dialogue Health released the Health and Well-Being Report: A Canadian Benchmark appeared first on CharityVillage.
When averaging out the results in sum, NECTAR found that their 2,684 subjects far preferred the animal "benchmark" products they were fed alongside fake meat products ranging from imitation bratwurst and burgers to ersatz pulled pork and deli slices.
The annual M+R BenchmarksStudy is a wide-ranging exploration of digital fundraising, advocacy, and marketing data. We’d like to invite you to come along by participating in our upcoming 2022 M+R Benchmarks. . The window to sign up as a Benchmarks participant is open NOW. Related Links: Benchmarks UK is here!
The much-anticipated 2013 eNonprofit Benchmarkstudy was released last week. Nonprofits often use this study to benchmark their own online activities and fundraising ideas. One of the eye-catching findings from the study was the steep decline in the performance of fundraising emails in 2012. percent to 4.5
Hoping to hop on the 2022 Benchmarks train? This Friday (December 3) is the last day to sign up to be part of the next Benchmarks journey ! And please reach out to benchmarks@mrss.com with any questions. The annual M+R BenchmarksStudy is a wide-ranging exploration of digital fundraising, advocacy, and marketing data.
There’s no wrong way to dig into our annual BenchmarksStudy, covering digital programs from marketing to fundraising to advocacy. Others prefer a sense of community and the chance to ask questions, and a few hundred of them joined us for a Benchmarks webinar yesterday. . 2020 M+R BenchmarksStudy—A Data Odyssey: The Recording.
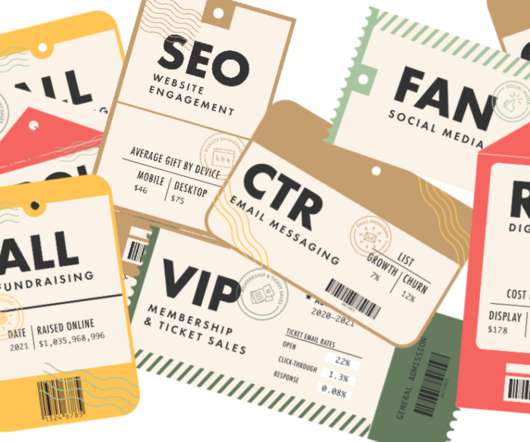
M+R Benchmarks ] Online Giving The average gift made on desktop devices is $194; for mobile users, the average gift is $94. [ M+R Benchmarks ] 25% of online donations were made on a mobile device in 2022. [ M+R Benchmarks ] 30% of all online giving occurs in December and 10% occurs in the last three days of the year.
For Nonprofits in the United States: 1) 2013 eNonprofit BenchmarksStudy :: Download. 4) 2012 Nonprofit Social Network Benchmark Report :: Download. 5) 2012 Online Marketing Nonprofit Benchmark™ Study :: Download. 6) 2012 mGive Text Giving Study :: Download. Most of the reports listed are based on U.S.
2013 eNonprofit BenchmarksStudy. View Full Infographic. Social Media for Social Good. View Full Infographic. Is My Association Sending Too Much Email? View Full Infographic. View Full Infographic. Architecture of a Donate Page. View Full Infographic. The Digital Giving Index. View Full Infographic. The Rise of the Nonprofit Sector.
The latest edition of the annual M+R BenchmarksStudy has arrived, and here’s your ticket to ride. About half of M+R Benchmarks participants reported working with social media influencers in 2023. The 2024 M+R BenchmarksStudy is a big, big operation, and there’s so much more waiting for you at mrbenchmarks.com.
You might be feeling a little of that frustration and FOMO if you missed the M+R Benchmarks webinar on April 27, but don’t worry — we would never leave you behind. . Finally, what would a journey like Benchmarks be without a custom roadtrip mixtape? The full webinar recording is available here.
TechSoup and Tapp Network released the results of the 2022-2023 Nonprofit Digital Marketing Benchmark Report, which reveals the strategies used by over 100 nonprofits in 2022 and their plans for improvement in 2023.
eNonprofit Benchmarkstudy. 13% – eNonprofit BenchmarkStudy. The average 1x donation is $60.00. Median revenue per donor for multichannel supporters was $339 compared to $88 for offline. – Blackbaud. First year retention for multichannel donors was 51%. On average fundraising responses rates range from.08%
We organize all of the trending information in your field so you don't have to. Join 12,000+ users and stay up to date on the latest articles your peers are reading.
You know about us, now we want to get to know you!
Let's personalize your content
Let's get even more personalized
We recognize your account from another site in our network, please click 'Send Email' below to continue with verifying your account and setting a password.


Let's personalize your content