This site uses cookies to improve your experience. To help us insure we adhere to various privacy regulations, please select your country/region of residence. If you do not select a country, we will assume you are from the United States. Select your Cookie Settings or view our Privacy Policy and Terms of Use.
Cookie Settings
Cookies and similar technologies are used on this website for proper function of the website, for tracking performance analytics and for marketing purposes. We and some of our third-party providers may use cookie data for various purposes. Please review the cookie settings below and choose your preference.
Used for the proper function of the website
Used for monitoring website traffic and interactions
Cookie Settings
Cookies and similar technologies are used on this website for proper function of the website, for tracking performance analytics and for marketing purposes. We and some of our third-party providers may use cookie data for various purposes. Please review the cookie settings below and choose your preference.
Strictly Necessary: Used for the proper function of the website
Performance/Analytics: Used for monitoring website traffic and interactions
Donor retention can feel like a never-ending cycle. Measuring the effectiveness of your efforts against broader nonprofit sector benchmarks can further refine your donor retention strategy , helping ensure your approach remains effective and informed. Ready to transform your approach to donor retention? Just by asking.
ASI has released the results of its global 2023 Membership Performance BenchmarkSurvey. The eigth annual survey, conducted in late 2022, examines membership trends, including recruiting, retention, and engagement.
The 2011 donorCentrics Internet and Multichannel Giving Benchmarking Report provides analysis of 28 major nonprofit organizations and transactions for over 15 million donors and more than $1 billion in revenue. Retention rates for online donors continue to lag offline donor trends. This is a recurring theme from previous studies.
Third Sector Labs recently co-hosted a donor retention webinar with Caity Craver , CEO of DonorTrends. The topic – “Donor Retention by the Numbers: Demystifying the Leaky Bucket” – focused on how to properly measure donor retention and then use that data to drive improved fundraising results.
The average nonprofit website has a 1% conversion rate ( according to the M+R Benchmarks report ) and this means that 99% of the people you get to visit your website leave without donating or subscribing to your email list. 5) Retention. By increasing your conversion rate to 1.5%
Employee retention is critical for the health of any organization, particularly for nonprofits. High retention leads to better outcomes all around as the organization saves money and develops stronger performers internally. Plus, as a manager in a nonprofit, retention is a key component of your job.
Source: Benchmarks. 7) Over the last 10 years, donor retention rates have been consistently weak – averaging below 50%. English, français, português y español, the 2018 Global NGO Technology Report is based on the survey results of 5,352 NGOs from 164 countries. Source: Charitable Giving Report. This app does not exist.
Even if not directly monetized, data products can enhance member benefits, fostering loyalty and retention within your association. By providing valuable industry insights, like surveys or industry data and training, associations enhance the perceived value of membership, encouraging retention and engagement.
How to Leverage LMS Data Analytics for Better Decision-Making in Corporate Training GyrusAim LMS GyrusAim LMS - In today’s competitive business landscape, Learning and Development (L&D) programs are key drivers of employee growth, retention, and overall business success.
Best-in-class companies don’t, a new survey-based report found. According to OpenView’s third annual product benchmarks report, which the VC firm presented in a blog post , “standout PLG companies reach out to only 14% of signups on average.” How fast things change!
When you hear directly from clients, you can better tailor services to their needs and preferences, which, in turn, helps increase client retention and impact. To collect a representative sample, we recommend administering surveys using multiple methods—in person, via text, by email, etc.
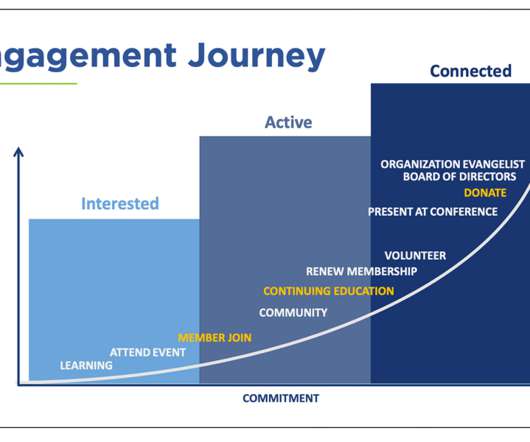
According to Marketing General Incorporated’s 2021 Marketing Benchmarking Report, 50% of associations surveyed believe lack of engagement is the top reason members didn’t renew. Because engagement is critical to retaining members, many associations are using a member engagement score to track and build loyalty.
Saturday, November 27, 2010 5 Reasons To Do An Employee Survey Business leaders who wonder whether they should conduct an employee survey should think about these five good reasons for conducting surveys, as recommended by John Kador and Katherine J. Armstrong in their book, Perfect Phrases for Writing Employee Surveys : 1.
Many employee engagement and retention tools were created with the assumption that workers spent most of their time at desks. A lot of them are also dissatisfied with their jobs , which means companies need to deal with high churn and low retention rates. Launched in November 2022, Mercu announced today it has raised $1.6
The annual M+R Benchmarks Report has arrived again, shining a light on trends that are shaping nonprofits’ digital programs. Having shared and discussed this year’s Benchmarks Report with many of our partners, here’s twelve key trends that have resonated strongly within the EveryAction community. Mobile list size grew by 35% in 2017.
A 2017 survey from Board Source shows that 84% of members on nonprofit boards identify as Caucasian, which does not sway far from the 2015 survey. A statement can also aid in recruitment and retention of board members. Examine current goals and objectives around board diversity and create benchmarks.
.” In his latest TC+ article, Paris Heymann (partner, Index Ventures), shares formulas for calculating Gross Dollar Retention and Net Dollar Retention, two KPIs that provide deep insights into the health of your business. For context, he also included GDR and NDR benchmarks for enterprise and SMB.
Schulman says that all startups struggle with figuring out stock options, equity, benchmarking data and promotion cycles because it’s an offline (and cumbersome) process. Clear communication about these details, though, helps with both hiring and retention. Is the industry ready to be benchmarked?
Particularly for peer-to-peer (P2P) fundraising, mobile capabilities have become crucial in meeting donors where they are, providing a simple, fun donor experience that results in higher turnout, increased revenue, and better year-over-year retention of event participants, donors, and P2P fundraisers. How do you pick the right event?
The first study is the “Peer-to-Peer Event Fundraising Consumer Survey&# which was developed by Blackbaud and the Run Walk Ride Fundraising Council. An online survey of individuals who have participated in at least one walk, ride, or run event in the last two years was conducted.
In this article, we’ll look at three important steps to take as you start planning your year-end fundraising campaign, including: Setting your year-end fundraising goals Identifying your campaign’s story Planning for donor retention Let’s take a look! You can read more about how to build a donor retention strategy over here.
In 2016, we set out to develop a rigorous methodology for tracking progress on diversity, equity and inclusion (DEI) in venture capital, and to measure and benchmark those data through our biennial VC Human Capital Survey. Once talent has come on board, inclusive culture and retention become key metrics of DEI progress.
This 1, 3, 5 year plan will serve as your road map, illustrating your course and outlining goals and benchmarks to hit. Most plans offer a benchmark against which actual performance can be measured and reviewed (more on this later.) It is important to establish a baseline and set benchmarks and goals to strive to achieve.
The seventh annual donorCentrics® Sustainer Summit brought together, via webinar, 31 of the nation’s largest national fundraising organizations to share results and discuss sustainer growth and retention strategies against the backdrop of the pandemic and other significant events that impacted donors and giving in 2020. Sustainer Retention.
Benchmarks let us know how we perform compared to our event fundraising peers. Metrics and benchmarks can be our guides to whether your efforts at creating a great experience for participants are paying off. Retention rate (of participants, team captains, team members). Team involvement is linked to higher retention rates.
Globally, charities raised 3x more in 2020 than 2019 using Blackbaud Peer-to-Peer Fundraising , powered by JustGiving® 2021’s P2P Benchmark Study. But in a survey, we found that 87% of fundraisers are likely to fundraise for an organization again. So how can charities better steward these relationships to increase retention?
You can always send out a survey to supporters after they give or include a couple of optional questions for them to answer on the gift confirmation page to collect additional information. Recurring donations are important for your nonprofit’s donor retention strategy. Here are just a few of the metrics you might want to track.
To wit, the platform has team members complete surveys that ask them to rate the truthfulness of statements like “We make decisions quickly” and “We focus on the most important things.” However, it’s unclear how effectively surveys, semiregular dialogues, and emails can replace one-on-one guidance.
How healthy are your donor retention rates? Donor retention rates measure how many donors give consecutively from one time period to the next without lapsing. Your donor retention rates are a clear indicator of the success of your stewardship strategies. Then, compare them to the average retention rates for nonprofits.
As noted in the 2021 M+R Benchmarks Study , nonprofits enjoyed a 32% bump in revenue from online sources from 2019 to 2020. It’s fine to send out print newsletters or advertise on billboards, but those efforts may not have the same impact they once did in achieving strong donor retention.
Over time, we’ve isolated certain benchmarks that provide clues to the health of an event. Common peer-to-peer benchmarks include the following: Repeat attendance. Industry benchmark reports identify how events similar to yours perform in the key performance categories. Start by using benchmark reports as a guide.
These questions and more are the focus of the 2015 Individual Donor Benchmark Report. Organizations surveyed raise 34 percent of their revenue from individuals. The average donor retention rate is 60 percent. Understanding Donor Retention. This year, we added a survey question about retention rate.
However, the main advantages of a well-executed stewardship strategy are the same across the board: Improved retention rates. According to DonorSearchs donor retention guide , Although stewardship and retention are separate steps in the traditional donor management lifecycle, they actually overlap.
They can also help them boost employee engagement and retention. After all, it encompasses the measurement of knowledge retention, skill application, and behavior change among learners. This can be measured by surveys, interviews, or focus groups. This can be measured by observations, surveys, or interviews.
They can also help them boost employee engagement and retention. After all, it encompasses the measurement of knowledge retention, skill application, and behavior change among learners. This can be measured by surveys, interviews, or focus groups. This can be measured by observations, surveys, or interviews.
They can also help them boost employee engagement and retention. After all, it encompasses the measurement of knowledge retention, skill application, and behavior change among learners. This can be measured by surveys, interviews, or focus groups. This can be measured by observations, surveys, or interviews.
Being able to benchmark performance against what other nonprofits are doing is an important starting point to understanding your own data. Fundraising Effectiveness Project (FEP) The Fundraising Effectiveness Project (FEP) is the industry standard for donor retention stats and other related donor engagement metrics.
However, if your goal is SMART—specific, measurable, attainable, relevant, and time-bound—you’ll have a clear benchmark to work toward and measure progress. These goals are specific and have a clear timeline for completion, giving the nonprofit team a clear and attainable benchmark to strive for. Show appreciation to volunteers.
You can always send out a survey to supporters after they give or include a couple of optional questions for them to answer on the gift confirmation page to collect additional information. Recurring donations are important for your nonprofit’s donor retention strategy. Here are just a few of the metrics you might want to track.
Improving engagement and retention A positive onboarding process increases employee engagement and retention. Gathering feedback for continuous improvement Organizations can collect feedback from new employees through surveys, feedback forms, and interviews or casual conversations.
Improving engagement and retention A positive onboarding process increases employee engagement and retention. Gathering feedback for continuous improvement Organizations can collect feedback from new employees through surveys, feedback forms, and interviews or casual conversations.
Be thinking about communicating to ensure retention while you’re planning how you’ll give event participants the best ever experience. In fact, they may outperform new participants by over 6x according to Blackbaud’s 2012 Peer-to-Peer Fundraising Benchmark Study. Post Event Survey.
Understanding the Donor Journey Donor Acquisition Donor Retention Donor Stewardship How to Communicate With Your Donors Donor Data Management 1. And by building stronger relationships with donors, you will increase donor retention and loyalty, creating a stable foundation for your mission to continue. Sound good?
For the most important dashboards, data teams can go a step further by creating a benchmark for respondents, like “We estimate the cost of maintaining this dashboard to be about $5,000 last quarter. In other cases, it will be a significant factor on customer acquisition and retention. In some cases, the data will be a nice to have.
We organize all of the trending information in your field so you don't have to. Join 12,000+ users and stay up to date on the latest articles your peers are reading.
You know about us, now we want to get to know you!
Let's personalize your content
Let's get even more personalized
We recognize your account from another site in our network, please click 'Send Email' below to continue with verifying your account and setting a password.


Let's personalize your content