This site uses cookies to improve your experience. To help us insure we adhere to various privacy regulations, please select your country/region of residence. If you do not select a country, we will assume you are from the United States. Select your Cookie Settings or view our Privacy Policy and Terms of Use.
Cookie Settings
Cookies and similar technologies are used on this website for proper function of the website, for tracking performance analytics and for marketing purposes. We and some of our third-party providers may use cookie data for various purposes. Please review the cookie settings below and choose your preference.
Used for the proper function of the website
Used for monitoring website traffic and interactions
Cookie Settings
Cookies and similar technologies are used on this website for proper function of the website, for tracking performance analytics and for marketing purposes. We and some of our third-party providers may use cookie data for various purposes. Please review the cookie settings below and choose your preference.
Strictly Necessary: Used for the proper function of the website
Performance/Analytics: Used for monitoring website traffic and interactions
Staying current with the latest digital marketing and fundraising trends and benchmarks is essential for nonprofits. Benchmarks Study 2024 :: Download [US] Published by M+R 2. 2024 Nonprofit Advertising Benchmark Study :: Download [US] Published by Whole Whale 8.
Now in its fourth edition, the 2019 Global NGO Technology Report provides 100+ technology benchmarksNGOs, NPOs, and charities worldwide. This year the benchmarks are available for six regions: Africa. A global average of the benchmark data – as well as Global NGO Technology Effectiveness Ratings – are also provided.
Rival IQ Social Media Industry Benchmark Report ] Nonprofits have an average engagement rate of 0.066% on Facebook. Rival IQ Social Media Industry Benchmark Report ] 53% of nonprofits spend on social media advertising. M+R Benchmarks Report ] Facebook/Meta results in an average return on ad spend (ROAS) of $0.48 on TikTok. [
Now its fourth edition, the 2019 Global NGO Technology Report has over 1,000 useful statistics for NGOs, NPOs, and charities worldwide. 75% of NGOs worldwide agree that social media is effective for fundraising. The stats below represent 5,721 organizations from 160 countries. Of those that use YouTube: 37) 42% use YouTube Live.
The reports listed below offer much-needed data to help your nonprofit, NGO, or charity craft your 2021-22 digital marketing and fundraising strategy. 2021 Global NGO Technology Survey & Open Data Project :: Take the Survey. 2019 Global NGO Technology Report :: Download. Benchmarks Study 2020 :: Download.
Email messaging drives 13% of all online revenue ( M+R Benchmarks Report ). For every 1,000 fundraising messages delivered via email, nonprofits raise $45 USD ( M+R Benchmarks Report ). Nonprofits sent an average of 59 email messages per subscriber in 2018 ( M+R Benchmarks Report ). M+R Benchmarks Report ). Mobile Giving.
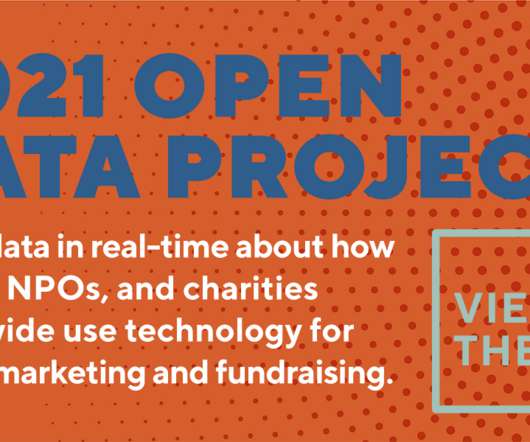
The 2021 Open Data Project [ español , français ] seeks to gain a better understanding of how nonprofits, NGOs, and charities worldwide use technology for digital marketing and fundraising. At the core of the project is the 2021 Global NGO Technology Survey. 6% use Wix. 5% use Squarespace.
Staying current with the latest digital marketing and fundraising trends and benchmarks is essential for nonprofits. Benchmarks Study 2023 :: Download [US] Published by M+R 2. Communications Benchmark Report 2022 :: Download [UK] Published by the CharityComms 11.
The Open Data Project seeks to gain a better understanding of how NGOs, NPOs, and charities worldwide use technology for digital marketing and fundraising. Please help promote the 2021 Global NGO Technology Survey in your country. The Open Data Project is basic in design, but significantly more useful to the global NGO sector.
2018 Global NGO Online Technology Report :: Download. 2017 Benchmarks Study :: Download. 2017 Luminate Online Benchmark Report :: Download. The 2018 Global NGO Technology Report. Most of the reports listed are based on U.S. nonprofit research. For Nonprofits Worldwide: 1. Published by the Blackbaud Institute.
Benchmarks Study 2022 :: Download. Facebook Fundraising Benchmark Report 2022 :: Download. Benchmarks UK Study 2021 :: Download. 2019 Global NGO Technology Report :: Download. The reports listed below offer much-needed data to help your nonprofit craft its 2022-23 digital marketing and fundraising strategy.
Over the last two decades the global NGO sector has embraced online technology, but economic and political factors and the quality of Internet infrastructure regionally often affects how well NGOs worldwide can use new technology. Key indicators that your NGO is effectively using online technology and social media. Cost: Free.
Source: 2016 Luminate Online Benchmark Report. 32% of NGOs worldwide have a written social media strategy and 34% have paid for advertising on social media. Source: 2017 Global NGO Online Technology Report. Source: 2017 Global NGO Online Technology Report. Source: 2017 Benchmarks Study. Source: ReportLinker.
2019 Global NGO Technology Report :: Download. Benchmarks Study 2020 :: Download. 2019 Email Deliverability Benchmarks Study :: Download. If you would like to suggest a specific report be added to the list, please contact Heather Mansfield or post a link in the comment section below. For Nonprofits Worldwide: 1.
Packed with practical advice and customized for small NGOs on a limited budget, this webinar will stress the importance of engaging website design, strategic email marketing, and current trends in online fundraising and social media. How to launch and maintain an email marketing strategy that consistently engages donors and supporters.
2018 Global NGO Technology Report :: Download. The 2019 Global NGO Technology Survey is now live. 2018 Benchmarks Study :: Download. The 2019 Global NGO Technology Survey is now live! If you work at a nonprofit or NGO, please volunteer 6-8 minutes of your time and take the survey. For Nonprofits Worldwide: 1.
Rival IQ Social Media Industry Benchmark Report ] Nonprofits have an average engagement rate of 0.066% on Facebook. Rival IQ Social Media Industry Benchmark Report ] 53% of nonprofits spend on social media advertising. M+R Benchmarks Report ] Facebook/Meta results in an average return on ad spend (ROAS) of $0.48 on TikTok. [
Source: Benchmarks. The 2018 Global NGO Technology Report. English, français, português y español, the 2018 Global NGO Technology Report is based on the survey results of 5,352 NGOs from 164 countries. Source: Charitable Giving Report. 2) 30% of online giving occurs in December. 10% on the last three days of the year.
The 2021 Open Data Project [ español , français ] seeks to gain a better understanding of how nonprofits, NGOs, and charities worldwide use technology for digital marketing and fundraising. To receive future updates about the Global NGO Technology Survey data, please sign up for Nonprofit Tech for Good’s email newsletter.
The Global NGO Technology Report is a biennial research project that seeks to gain a better understanding of how non-governmental organizations (NGOs) worldwide use web and email communications, online fundraising tools, social media, mobile technology, and productivity software. 1: Giving Tuesday — #GivingTuesday.
Rival IQ Social Media Industry Benchmark Report ] Nonprofits have an average engagement rate of 0.066% on Facebook. Rival IQ Social Media Industry Benchmark Report ] 53% of nonprofits spend on social media advertising. M+R Benchmarks Report ] Facebook/Meta results in an average return on ad spend (ROAS) of $0.48 on TikTok. [
The survey is anonymous and your participation will help provide charitable giving benchmarks for nonprofits, NGOs, and charities worldwide. to Funraise for generously supporting the Global Trends in Giving Report and the Global NGO Technology Report. Please volunteer 5-10 minutes of your time and take the survey! <<
Over the last two decades the NGO sector has embraced technology, but economic and political factors and the quality of Internet infrastructure regionally often affects how well NGOs worldwide can use technology. Attendees will gain insight by learning benchmarks for success based on NGOs across six continents.
Over those three years, Nonprofit Tech for Good and PIR trained more than 60,000 NPO and NGO staff worldwide! Due to the decline in reach on social media, nonprofits should prioritize email communications and fundraising in 2018 [ Benchmarks for Success ]. You can view the webinar archive on SlideShare. The Internet of Things.
<< View All Upcoming Free Webinars >> The Global NGO Technology Report is a biennial research project that seeks to gain a better understanding of how non-governmental organizations (NGOs) worldwide use web and email communications, online fundraising tools, social media, mobile technology, and productivity software. . <<
The Global NGO Technology Report is a biennial research project that seeks to gain a better understanding of how non-governmental organizations (NGOs) worldwide use web and email communications, online fundraising tools, social media, mobile technology, and productivity software. Transparency.
The third edition of the Global Trends in Giving Report (the sister report to the 2019 Global NGO Technology Report ) will be published September 15, 2020 , and for the first time, we are conducting an open call for partners worldwide.
The Global NGO Technology Report is a biennial research project that seeks to gain a better understanding of how non-governmental organizations (NGOs) worldwide use web and email communications, online fundraising tools, social media, mobile technology, and productivity software.
A collaborative research project by the Public Interest Registry and Nonprofit Tech for Good, the 2016 Global NGO Online Technology Report is an inaugural effort to gain a better understanding of how non-governmental organizations (NGOs) worldwide use online technology to communicate with their supporters and donors.
The Global NGO Technology Report is a biennial research project that seeks to gain a better understanding of how non-governmental organizations (NGOs) worldwide use web and email communications, online fundraising tools, social media, mobile technology, and productivity software.
Source: Global NGO Online Technology Report. 95% of NGOs worldwide have a Facebook Page. Source: Global NGO Online Technology Report. Source: M+R Benchmarks Study. Source: M+R Benchmarks Study. The 2016 Global NGO Online Technology Report. 2,780 NGOs • 133 Countries • 6 Continents. of those accounts.
The Global NGO Technology Report is a biennial research project that seeks to gain a better understanding of how non-governmental organizations (NGOs) worldwide use web and email communications, online fundraising tools, social media, mobile technology, and productivity software.
2016 Global NGO Online Technology Report :: Download. 2016 Nonprofit Benchmarks Study :: Download. Most of the reports listed are based on U.S. nonprofit research, but Nonprofit Tech for Good would also like to add similar reports from other regions of the world. For Nonprofits Worldwide: 1. 2015 World Giving Index :: Download.
Based on data gleaned from the 2017 Global NGO Online Technology Report , below are 27 stats about how NGOs worldwide are using online technology. For this year’s report, 4,908 NGOs participated. 92% of global NGOs have a website. Webinar Slides: Presented 2/2/17 to 1,600+ NGO staff. View on SlideShare.
According to the Global NGO Technology Report , 47% of nonprofits purchased Facebooks Ads in 2019. In terms of Facebook Ads cost benchmarks, here is a useful summary from Web FX based on $300 million in spending: 4) Add a “Donate” button to your page and posts.
2017 Global NGO Online Technology Report :: Download. 2016 Nonprofit Benchmarks Study :: Download. Most of the reports listed are based on U.S. nonprofit research, but Nonprofit Tech for Good would also like to add similar reports from other regions of the world. For Nonprofits Worldwide: 1. 2016 World Giving Index :: Download.
Once I recover from the journey, expect read reports about the Networked NGO in Rwanda and use of social media to support Women’s Rights organizations. The online marketing survey gathered extensive data and benchmarks about how small businesses and nonprofits use online marketing and whether they are seeing results.
Published on March 12, 2025 5:56 PM GMT Summary The Stages-Oversight benchmark from the Situational Awareness Dataset tests whether large language models (LLMs) can distinguish between evaluation prompts (such as benchmark questions) and deployment prompts (real-world user inputs).
We’ll draw from recent experiences in setting up an active advisory group made up of NGO partners from all corners of the globe; our network-wide campaign to survey NGO technology trends in 24 languages; and, our own technology solution to communicating with these partners to deliver services in 37 countries. Claire Sale.
The annual 2013 eNonprofit Benchmark Study by NTEN and M+R Strategic Services is now out. Now the bad news: the international NGO sector saw a decline in online giving. Congratulations to the winning app developers and all those who participated in creating apps for positive change. NPTech Online Fundraising Trends. Social Media.
The annual 2013 eNonprofit Benchmark Study by NTEN and M+R Strategic Services is now out. Now the bad news: the international NGO sector saw a decline in online giving. Congratulations to the winning app developers and all those who participated in creating apps for positive change. NPTech Online Fundraising Trends. Social Media.
Some customers find InstructGPT’s responses significantly less creative than the pretrained models’, something we hadn’t realized from running InstructGPT on publicly available benchmarks. If this interests you, we’re hiring Research Engineers and Research Scientists !
If cost benchmarking doesn’t make sense (as in the field of human rights), can we dramatically change the way people operate in a given area? Benetech successfully spun off our data team as the Human Rights Data Analysis Group, an independent NGO.
My trusted sources, if you want to do a little bit more research anytime I cite a statistic, it’s always going to be from Pew Internet, M+R Benchmarks, Global Trends In Giving. So, yes, I think the Global NGO Technology Report found the majority of nonprofits do agree social media is effective for creating brand awareness.
We organize all of the trending information in your field so you don't have to. Join 12,000+ users and stay up to date on the latest articles your peers are reading.
You know about us, now we want to get to know you!
Let's personalize your content
Let's get even more personalized
We recognize your account from another site in our network, please click 'Send Email' below to continue with verifying your account and setting a password.


Let's personalize your content