This site uses cookies to improve your experience. To help us insure we adhere to various privacy regulations, please select your country/region of residence. If you do not select a country, we will assume you are from the United States. Select your Cookie Settings or view our Privacy Policy and Terms of Use.
Cookie Settings
Cookies and similar technologies are used on this website for proper function of the website, for tracking performance analytics and for marketing purposes. We and some of our third-party providers may use cookie data for various purposes. Please review the cookie settings below and choose your preference.
Used for the proper function of the website
Used for monitoring website traffic and interactions
Cookie Settings
Cookies and similar technologies are used on this website for proper function of the website, for tracking performance analytics and for marketing purposes. We and some of our third-party providers may use cookie data for various purposes. Please review the cookie settings below and choose your preference.
Strictly Necessary: Used for the proper function of the website
Performance/Analytics: Used for monitoring website traffic and interactions
Staying current with the latest digital marketing and fundraising trends and benchmarks is essential for nonprofits. Benchmarks Study 2024 :: Download [US] Published by M+R 2. 2024 Nonprofit Advertising Benchmark Study :: Download [US] Published by Whole Whale 8.
Rival IQ Social Media Industry Benchmark Report ] Nonprofits have an average engagement rate of 0.066% on Facebook. Rival IQ Social Media Industry Benchmark Report ] 53% of nonprofits spend on social media advertising. M+R Benchmarks Report ] Facebook/Meta results in an average return on ad spend (ROAS) of $0.48 on TikTok. [
Now in its fourth edition, the 2019 Global NGO Technology Report provides 100+ technology benchmarksNGOs, NPOs, and charities worldwide. The data reveals how organizations use web and email communications, online fundraising, social media, productivity software, and emerging technology.
At the core of the project is the 2021 Global NGO Technology Survey and the data below is based on the survey responses of 478 nonprofit email marketing managers. To receive future updates about the Global NGO Technology Survey data, please sign up for Nonprofit Tech for Good’s email newsletter.
Now its fourth edition, the 2019 Global NGO Technology Report has over 1,000 useful statistics for NGOs, NPOs, and charities worldwide. In addition to social media stats, the report also provides data for how organizations use web and email communications, online fundraising tools, productivity software, and emerging technology trends.
The reports listed below offer much-needed data to help your nonprofit, NGO, or charity craft your 2021-22 digital marketing and fundraising strategy. 2021 Global NGO Technology Survey & Open Data Project :: Take the Survey. 2019 Global NGO Technology Report :: Download. Benchmarks Study 2020 :: Download.
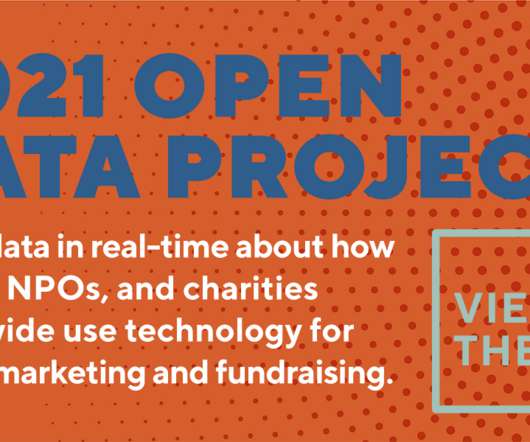
The 2021 Open Data Project [ español , français ] seeks to gain a better understanding of how nonprofits, NGOs, and charities worldwide use technology for digital marketing and fundraising. At the core of the project is the 2021 Global NGO Technology Survey. 6% use Wix. 5% use Squarespace. 6% use Wix. 5% use Squarespace. 6% use Wix.
Email Fundraising. Email messaging drives 13% of all online revenue ( M+R Benchmarks Report ). For every 1,000 fundraising messages delivered via email, nonprofits raise $45 USD ( M+R Benchmarks Report ). Nonprofits sent an average of 59 email messages per subscriber in 2018 ( M+R Benchmarks Report ).
Staying current with the latest digital marketing and fundraising trends and benchmarks is essential for nonprofits. Benchmarks Study 2023 :: Download [US] Published by M+R 2. Nonprofit Email Report 2023 :: Download [US] Published by Neon One 6. The Giving Report 2023 :: Download [Canada] Published by CanadaHelps 3.
Over the last two decades the global NGO sector has embraced online technology, but economic and political factors and the quality of Internet infrastructure regionally often affects how well NGOs worldwide can use new technology. Topics include: How NGOs worldwide differ in their use of web and email communications.
2019 Global NGO Technology Report :: Download. Benchmarks Study 2020 :: Download. 2019 Email Deliverability Benchmarks Study :: Download. Sign up for Nonprofit Tech for Good’s email newsletter to be alerted of new posts. For Nonprofits Worldwide: 1. Published by Funraise and Nonprofit Tech for Good.
The Open Data Project seeks to gain a better understanding of how NGOs, NPOs, and charities worldwide use technology for digital marketing and fundraising. Please help promote the 2021 Global NGO Technology Survey in your country. The Open Data Project is basic in design, but significantly more useful to the global NGO sector.
Source: 2016 Luminate Online Benchmark Report. 32% of NGOs worldwide have a written social media strategy and 34% have paid for advertising on social media. Source: 2017 Global NGO Online Technology Report. Source: 2017 Global NGO Online Technology Report. Source: 2017 Benchmarks Study. Source: ReportLinker.
Packed with practical advice and customized for small NGOs on a limited budget, this webinar will stress the importance of engaging website design, strategic email marketing, and current trends in online fundraising and social media. How to launch and maintain an email marketing strategy that consistently engages donors and supporters.
Rival IQ Social Media Industry Benchmark Report ] Nonprofits have an average engagement rate of 0.066% on Facebook. Rival IQ Social Media Industry Benchmark Report ] 53% of nonprofits spend on social media advertising. M+R Benchmarks Report ] Facebook/Meta results in an average return on ad spend (ROAS) of $0.48 on TikTok. [
They experimented with placement and color, SEO, and new email marketing services, such as ConstantContact and MailChimp. Looking forward, online fundraising is set for exponential growth and despite all the buzz about social media and mobile tech, good ole email still rules. Source: Benchmarks. of their total revenue online.
Rival IQ Social Media Industry Benchmark Report ] Nonprofits have an average engagement rate of 0.066% on Facebook. Rival IQ Social Media Industry Benchmark Report ] 53% of nonprofits spend on social media advertising. M+R Benchmarks Report ] Facebook/Meta results in an average return on ad spend (ROAS) of $0.48 on TikTok. [
Over those three years, Nonprofit Tech for Good and PIR trained more than 60,000 NPO and NGO staff worldwide! The Revival of Email. billion email accounts worldwide and the number is expected to grow to 7.7 Email accounted for 26% of all online revenue in 2016 and grew 14% over 2015. 56% of email opens are now mobile.
Over the last two decades the NGO sector has embraced technology, but economic and political factors and the quality of Internet infrastructure regionally often affects how well NGOs worldwide can use technology. Attendees will gain insight by learning benchmarks for success based on NGOs across six continents.
The Global NGO Technology Report is a biennial research project that seeks to gain a better understanding of how non-governmental organizations (NGOs) worldwide use web and email communications, online fundraising tools, social media, mobile technology, and productivity software. 1: Giving Tuesday — #GivingTuesday.
The third edition of the Global Trends in Giving Report (the sister report to the 2019 Global NGO Technology Report ) will be published September 15, 2020 , and for the first time, we are conducting an open call for partners worldwide. There is no personal identifiable information (name, mailing address, email, etc.). How to Apply.
<< View All Upcoming Free Webinars >> The Global NGO Technology Report is a biennial research project that seeks to gain a better understanding of how non-governmental organizations (NGOs) worldwide use web and email communications, online fundraising tools, social media, mobile technology, and productivity software. . <<
The Global NGO Technology Report is a biennial research project that seeks to gain a better understanding of how non-governmental organizations (NGOs) worldwide use web and email communications, online fundraising tools, social media, mobile technology, and productivity software.
The Global NGO Technology Report is a biennial research project that seeks to gain a better understanding of how non-governmental organizations (NGOs) worldwide use web and email communications, online fundraising tools, social media, mobile technology, and productivity software.
The Global NGO Technology Report is a biennial research project that seeks to gain a better understanding of how non-governmental organizations (NGOs) worldwide use web and email communications, online fundraising tools, social media, mobile technology, and productivity software.
Please sign up for Nonprofit Tech for Good’s email newsletter to be alerted of new posts. According to the Global NGO Technology Report , 47% of nonprofits purchased Facebooks Ads in 2019. That’s equivalent to sending an email to your supporters and 98% of your emails going to spam folders.
And email ROI and online giving is up, up, up! In reality, the peak years of email, online fundraising, and social media are ahead of us and the next decade will astound us all. Gen X and Baby Boomers by email. Source: Global NGO Online Technology Report. 95% of NGOs worldwide have a Facebook Page. Source: Abila.
A collaborative research project by the Public Interest Registry and Nonprofit Tech for Good, the 2016 Global NGO Online Technology Report is an inaugural effort to gain a better understanding of how non-governmental organizations (NGOs) worldwide use online technology to communicate with their supporters and donors.
The Global NGO Technology Report is a biennial research project that seeks to gain a better understanding of how non-governmental organizations (NGOs) worldwide use web and email communications, online fundraising tools, social media, mobile technology, and productivity software.
Based on data gleaned from the 2017 Global NGO Online Technology Report , below are 27 stats about how NGOs worldwide are using online technology. For this year’s report, 4,908 NGOs participated. 92% of global NGOs have a website. 92% of global NGOs have a website. Medium NGOs have 44,768. 3% use.NGO.
We’ll draw from recent experiences in setting up an active advisory group made up of NGO partners from all corners of the globe; our network-wide campaign to survey NGO technology trends in 24 languages; and, our own technology solution to communicating with these partners to deliver services in 37 countries. Lara Franklin.
The device will have a touch screen with a grid of pins that form Braille characters based on SMS or email messages. The annual 2013 eNonprofit Benchmark Study by NTEN and M+R Strategic Services is now out. It's a 40-page study that measures what's going on with nonprofit email, fundraising, social media, and mobile.
The annual 2013 eNonprofit Benchmark Study by NTEN and M+R Strategic Services is now out. It's a 40-page study that measures what's going on with nonprofit email, fundraising, social media, and mobile. Here are some key findings: Email list sizes are up by 15 percent. NPTech Online Fundraising Trends. Social Media.
My trusted sources, if you want to do a little bit more research anytime I cite a statistic, it’s always going to be from Pew Internet, M+R Benchmarks, Global Trends In Giving. So, yes, I think the Global NGO Technology Report found the majority of nonprofits do agree social media is effective for creating brand awareness.
We organize all of the trending information in your field so you don't have to. Join 12,000+ users and stay up to date on the latest articles your peers are reading.
You know about us, now we want to get to know you!
Let's personalize your content
Let's get even more personalized
We recognize your account from another site in our network, please click 'Send Email' below to continue with verifying your account and setting a password.


Let's personalize your content