This site uses cookies to improve your experience. To help us insure we adhere to various privacy regulations, please select your country/region of residence. If you do not select a country, we will assume you are from the United States. Select your Cookie Settings or view our Privacy Policy and Terms of Use.
Cookie Settings
Cookies and similar technologies are used on this website for proper function of the website, for tracking performance analytics and for marketing purposes. We and some of our third-party providers may use cookie data for various purposes. Please review the cookie settings below and choose your preference.
Used for the proper function of the website
Used for monitoring website traffic and interactions
Cookie Settings
Cookies and similar technologies are used on this website for proper function of the website, for tracking performance analytics and for marketing purposes. We and some of our third-party providers may use cookie data for various purposes. Please review the cookie settings below and choose your preference.
Strictly Necessary: Used for the proper function of the website
Performance/Analytics: Used for monitoring website traffic and interactions
Recent donorCentrics Sustainer Benchmarkingstudies show that some 6% of monthly donors will make at least one extra gift a year when asked, so not asking is definitely leaving money on the table. Here's how to go about it.
Shortly after the nonprofit sector learned that both overall donors and donor dollars had declined, M+R confirmed the downward trends with M+R Benchmarks 2023, noting a 4% median decline in year-over-year online revenue for nonprofits.
Online donor solicitations are powerful. The allure to both nonprofits and potential donors is obvious. The Surprising Truth About Online Donors. Many organizations see the immediacy of giving, the larger average donations from online donors, and the relatively low costs in producing solicitations and look no further.
While BIPOC (Black, Indigenous, and people of color) donors have been taking care of their communities for generations, they have yet to be significantly represented in traditional philanthropy. The Donors of Color Network (DOCN), a community of BIPOC donors, is part of that movement. So, how can we empower BIPOC donors?
How, exactly, can you accomplish these things and ensure more potential donors complete the giving process? let donors also give to projects that are meaningful to them. Some nonprofits do this by asking monthly donors to “join the club” and give them names like Miracle Makers , Partners for Change , and Guardian Angels.
In 2010, only 6% of donors said that an e-appeal motivated a gift. Sustainer income from monthly donors grew 10% in 2016. Source: 2016 Luminate Online Benchmark Report. High-wealth donors ($200,000+ in annual household income) give an average of $2,252 annually and 51% prefer to give online. In 2015, that jumped to 20%.
The maître d’ has called your name, the table is set, and the napkins are folded up like fancy little swans: it’s time to dig in to a year’s worth of M+R Benchmarks charts, findings, and insights at mrbenchmarks.com ! We also compare retention rates and annual value for one-time and monthly donors. Sign up for the webinar now.
The 2011 donorCentrics Internet and Multichannel Giving Benchmarking Report provides analysis of 28 major nonprofit organizations and transactions for over 15 million donors and more than $1 billion in revenue. The dominate giving channel for new donors 64 years old and younger is online — not offline. They get worse over time.
Online Fundraising Strategy 93% of nonprofits believe that a strong brand identity has a positive impact on donor engagement. 99designs ] 75% of donors look for concrete information about a nonprofit’s achievements before making a decision to give. Double the Donation ] The current donor retention rate is 41.9%. billion—only 0.6%
Sending donors a third-party payment site, such as PayPal, is problematic if that is the only way that donors can give. According to Network for Good , one in six online donors will drop out of the donation process if they are sent to a third-party website. Monthly donors give $35.46
eNonprofit Benchmarkstudy. Median revenue per donor for multichannel supporters was $339 compared to $88 for offline. First year retention for multichannel donors was 51%. 13% – eNonprofit BenchmarkStudy. Provide compelling reasons to donate and tell donors how their hard earned money is being spent.
If you want to dig into all of the results, you can check out the full study (including 32 unique and data-driven test ideas) at: recurringgiving.com. The first area we analyzed was how organizations are getting donors on their homepage to the donation page. A 64% increase in recurring donors. The result?
The first “Donate Now” button was released in 1999 by a project of the Tides Foundation called Groundspring (acquired by Network for Good in 2005) and for the next two decades, nonprofit professionals have embraced the study of inspiring people to give online to good causes. And don’t be shy about sending emails!
Dennis McCarthy and I had the pleasure of presenting Online Benchmarking: What Worked in 2012 at the Nonprofit Technology Conference in Minneapolis, MN. NTEN and M&R also released their report, the 2013 eNonprofit BenchmarksStudy. A benchmarkstudy is a tool, and like any tool, it depends on how it’s used.
NTEN partnered with Charity Dynamics to conduct the 2012 Nonrprofit Donor Engagement Study. This donor-focused study gathered feedback from consumers spanning a wide range of giving levels ($25 – $5,000+) who donated to a nonprofit in the past 12 months. > Download the study online here.
Monthly donors give 42% more over the course of a year compared to one time donors. They also stick around longer with most programs enjoying donor retention rates north of 85%. If executed correctly, a successful monthly donor program can be a game changer for your nonprofit.
Last month we reported that online fundraising response rates declined 27% between 2011-2012, according to the eNonprofit Benchmarkstudy. Online fundraising was driven primarily by recurring donors and repeat donors, which grew 27 percent and 20 percent, respectively. Nonprofit BenchmarkStudies'
Check out the 2010 eNonprofit BenchmarksStudy from M+R Strategic Services and NTEN which surveyed 40 nonprofit organizations and analyzed all of this data and more. Key Benchmarks: How Did Your Nonprofit Measure Up ? Are enewsletters still worth your organization’s time? Are nonprofits experimenting with mobile more?
According to the Fidelity Charitable Overcoming Barriers to Giving Report , 65% of donors would give more if they knew the impact of their donations. Annual reports are too infrequent and written for foundations and major donors, thus not ideal for reporting impact to small and mid-size donors. M+R Benchmarks Report.
Last month I donated online to 25 of my 32 Favorite Nonprofits in celebration of reaching the benchmark of following 100,000 nonprofits, nonprofit staff, and nonprofit service providers on Twitter. What a lost opportunity to convert their donors into Facebook Fans, Twitter and Pinterest Followers, and blog subscribers!
According to the M+R Benchmarks report , fundraising mobile messages generate an average of $92 in revenue for every 1,000 messages sent. Regardless of what you call it, mobile giving is one of the most popular ways for nonprofits to raise moneyand retain more donors on the go. Step 5: Track and analyze data to improve over time.
Without a doubt, your nonprofit’s donors and supporters use Facebook on a regular basis and thus Facebook should be your first priority in your social media strategy. In terms of Facebook Ads cost benchmarks, here is a useful summary from Web FX based on $300 million in spending: 4) Add a “Donate” button to your page and posts.
Communicating the stories of your nonprofit is the most powerful means of inspiring your donors and supporters. When done well, storytelling will evoke emotions ranging from empathy to anger that will galvanize your donors and supporters to take action on behalf of your nonprofit. Storytelling. Fundraising. Engagement.
The accepted best practice is to post to Instagram once to three times daily, but for most nonprofits posting more than once daily is a ridiculous benchmark. To reach the 10,000 follower benchmark, send an email to your list asking your supporters to follow you on Instagram or purchase advertising to secure more followers.
As fundraisers, were also storytellers and every donor has a story. When we can identify what those stories are and understand the kind of path our donors follow at each stage of the giving process, we can gently guide their journey, connect with them at a deeper level, build strong relationships, and improve fundraising results.
The more engagement your video receives, the wider its reach and visibility will be, giving you access to millions of prospective fans, donors and partners without any additional work or expense. Psychologists have been studying the interplay between emotion and behavior for almost 150 years. What factors contribute to engagement?
Our partnership model is simple and innovative: in exchange for promoting the 2020 Global Trends in Giving Survey to donors and supporters of nonprofit organizations in your country from March 1 through May 31, 2020 , our partners receive the anonymized survey data for their country or cause. Example 2: You are a media outlet in South Africa.
—– I’ve recently shared a couple interviews exploring two case studies of really successful online fundraising campaigns: SXSW4Japan Raises Over $120,000 and $100,000 in Three Days with #TeamAutism. The 2011 Millennial Donor report , the second in an annual series, focuses on engaging Millennials in fundraising.
This post offers an overview of NTEN's eNon-profits BenchmarkStudy and 2011 Social Benchmarks Report and Idealware's Donor Management System Workbook.( Here is a round-up of recently released reports and resources available free of charge that might be of interest to non-profit and membership organizations.
2016 Nonprofit BenchmarksStudy :: Download. 2016 Donor Engagement Study :: Download. 2015 Text Donation Study :: Download. Identifying the Crowdfunding Donor: 2014 Donor Demographics :: Download. 2014 Cone Communications Digital Activism Study :: Download. Published by M+R and NTEN.
Communicating the stories of your nonprofit is the most powerful means of inspiring your donors and supporters. When done well, storytelling will evoke emotions ranging from empathy to anger that will galvanize your donors and supporters to take action on behalf of your nonprofit. Storytelling. Fundraising. Engagement.
If your nonprofit is not developing yearly benchmarks for its fundraising program, website visits, email and e-newsletter open and click-through rates, start now. Establishing benchmarks helps organizations better leverage supporters, engage activists and keep websites dynamic with compelling content that drives people to take action.
The sixth annual Convio Online Marketing Benchmark Index Study is now officially released. As monthly giving typically increases a donor’s lifetime value, this positive trend is very good news for the nonprofit sector and the causes being served. For a summary of trends seen in the benchmark, watch my video here.
The 2011 donorCentrics Internet and Multichannel Giving Benchmarking Report provides analysis of 28 major nonprofit organizations and transactions for over 15 million donors and more than $1 billion in revenue. The dominate giving channel for new donors 64 years old and younger is online — not offline.
Email is still a major component of organizational communication and a channel used by nonprofit supporters and donors; it is critical that it grows and develops to match the changing ways we use it and share messages. For those who didn’t attend, what are some of the nonprofit technology topics, tools, or case studies on your mind lately?
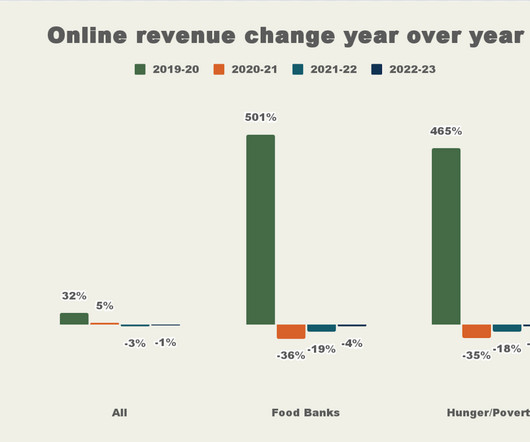
This year, a record 27 regional food banks participated in M+R’s annual BenchmarksStudy covering mostly digital fundraising, marketing, advertising, and advocacy metrics (and here’s another plug…if you haven’t dug into this year’s study, do it now!). Now — let’s get into one of my favorite topics — Food Bank fundraising data!
Care2 is pleased to provide this overview of The Online Giving Study: A Call to Reinvent Donor Relationships just released by Network for Good and True Sense Marketing. The study, which you can download here , summarizes “$381 million in online giving through Network for Good’s platform, including 3.6
Next each of the panelists presented a research study based that combined large sample survey data on our issue area and appended actual social media activity usage. Jeremiah presented an overview of his study about the collaborative economy and you find Jeremiah’s report and infographic here.
Convio released their 2010 Online Nonprofit BenchmarkStudy in March, based on results from nearly 500 clients. Donors were still giving, but in smaller amounts. This has been the finding of several studies over the past few years, and isn't surprising. Its findings included: 14% growth in online giving overall.
All Blackbaud Blogs Contact Us Blackbaud.com About Nonprofit Trends Books Research Reports Speaking Top States for New Donors & Online Donors Posted by Steve MacLaughlin on November 23rd, 2010 Blackbaud has a tremendous amount of data about the nonprofit sector. That’s the power and importance of benchmarking.
The study looked at the flow of donation pages on each of the nonprofits websites as well as email appeals, follow up emails, etc. Forcing users to go through multiple steps is one of the fastest ways to lose donors. Welcome People Many organizations have a welcome series to introduce new donors to their email list.
The 2011 eNonprofit BenchmarksStudy is a joint project of M+R Strategic Services and the Nonprofit Technology Network (NTEN). The 2011 eNonprofit BenchmarksStudy (available at www.e-benchmarksstudy.com The 2011 Benchmarks average unsubscribe rate is 0.23%. benchmarksstudy.com if you haven’t read it yet!)
According to the Global Trends in Giving Report , 27% of online donors say that email is the tool that most inspires them to give (social media 29%, 18% website, 12% print). According to 14 different studies, the best time to send email campaigns is on Tuesdays at 10 am. Email messaging raised 28% of all online revenue in 2017.
Data in the new Trends 2025 report, shows that donors are shifting from a donor-centric mindset to a community-centric one. More donors are employing principle-based practices that incorporate accountability, equity, learning, and relationships into their governance, operations, and grantmaking.
We organize all of the trending information in your field so you don't have to. Join 12,000+ users and stay up to date on the latest articles your peers are reading.
You know about us, now we want to get to know you!
Let's personalize your content
Let's get even more personalized
We recognize your account from another site in our network, please click 'Send Email' below to continue with verifying your account and setting a password.


Let's personalize your content