This site uses cookies to improve your experience. To help us insure we adhere to various privacy regulations, please select your country/region of residence. If you do not select a country, we will assume you are from the United States. Select your Cookie Settings or view our Privacy Policy and Terms of Use.
Cookie Settings
Cookies and similar technologies are used on this website for proper function of the website, for tracking performance analytics and for marketing purposes. We and some of our third-party providers may use cookie data for various purposes. Please review the cookie settings below and choose your preference.
Used for the proper function of the website
Used for monitoring website traffic and interactions
Cookie Settings
Cookies and similar technologies are used on this website for proper function of the website, for tracking performance analytics and for marketing purposes. We and some of our third-party providers may use cookie data for various purposes. Please review the cookie settings below and choose your preference.
Strictly Necessary: Used for the proper function of the website
Performance/Analytics: Used for monitoring website traffic and interactions
Open data is the idea that some data should be freely available to everyone to use a nd republish as they wish. The Open Data Project seeks to gain a better understanding of how NGOs, NPOs, and charities worldwide use technology for digital marketing and fundraising. The more survey respondents we have, the better the data.
With data from nearly 1,500 nonprofits, nonprofit software provider Neon One has evaluated more than 37,000 email campaigns totaling more than 157 million individual emails for “The Nonprofit Email Report.” The new report provides a look at nonprofit email benchmarks for both large and small organizations.
Download now to access benchmarks, donor insights, data-backed strategies, and advice from industry fundraising experts. Recurring donors are easy to retain, highly engaged, and deeply connected to the causes they love. If you want to expand your recurring giving program, this resource is for you.
The 2021 Open Data Project [ español , français ] seeks to gain a better understanding of how nonprofits, NGOs, and charities worldwide use technology for digital marketing and fundraising. To receive future updates about the Global NGO Technology Survey data, please sign up for Nonprofit Tech for Good’s email newsletter.
The 2024 Canadian Direct Mail Benchmarksreport is here! Good Works is thrilled to once again bring you this totally free report, packed with all-Canadian data to help you measure your direct mail program against yourself, and against the sector.
The 16th annual Blackbaud Luminate Online BenchmarkReport is here! We look forward to this report every year. To encourage you to download and read the full report , we are sharing a few highlights we think you will find particularly compelling.
The new Blackbaud Luminate Online BenchmarkReport is out, and it has some significant differences from previous years. What are those differences, and what can you take away from this year’s report? Topics Discussed in This Episode: Background on the Luminate Online BenchmarkReport. Growing sustainer programs.
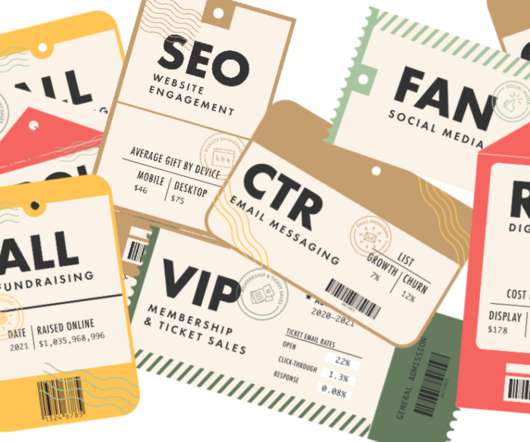
USD ( Blackbaud Luminate Online Report ). of overall fundraising in 2018 came from online giving ( Charitable Giving Report ). 1% via text message ( Global Trends in Giving Report ). However, 19% of donors return within the first 90 days ( The State of Modern Philanthropy Report ). 11% via direct mail/post.
The first-ever Benchmarks UK supplement has hit international newsstands! Discussion of the digital space is often quite dominated by a US-centric perspective, but the kind of data we share in Benchmarks is only useful to the extent that it’s relevant to your experience. Other stories required a bit more in-depth reporting.
How to Leverage LMS Data Analytics for Better Decision-Making in Corporate Training GyrusAim LMS GyrusAim LMS - In today’s competitive business landscape, Learning and Development (L&D) programs are key drivers of employee growth, retention, and overall business success. billion in 2020–21.
The 2024 AI Index Report shows rapid advancements in AI technology. Benchmarks created to assess the performance of AI tools compared with humans on tasks such as image classification, visual reasoning, and English understanding show the gaps narrowing.
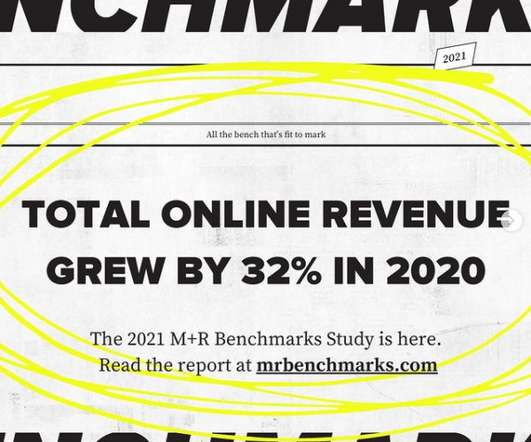
The maître d’ has called your name, the table is set, and the napkins are folded up like fancy little swans: it’s time to dig in to a year’s worth of M+R Benchmarks charts, findings, and insights at mrbenchmarks.com ! yes) The full feast of data and analysis is waiting for you at mrbenchmarks.com. Sign up for the webinar now.
We are excited to report that the 2021 M+R Benchmarks Study is ready for you. Thanks to contributions from 220 amazing nonprofit participants, this year’s Benchmarks Study covers detailed data including digital ads, social media, email, web traffic, mobile messaging, and more. . 2021 Benchmarks UK FAQ.
Between June and September of 2022, TechSoup, in partnership with the digital marketing and technology agency Tapp Network, built the Nonprofit Digital Marketing Benchmark Survey. We compared the findings to those gathered in the 2020-2021 Nonprofit Digital Marketing Benchmark Survey and Report.
Benchmarking against peers can help you refine your assumptions about what being financially sustainable could look likeor develop entirely new assumptions. In this article, well outline a three-step process adapted from our report Finding Your Funding Strategy: Benchmarking 101 , tailored to U.S.-based based nonprofits.
With careful record keeping and data management, you are likely able to make the case that your nonprofit’s return on investment (ROI) is acceptable no matter the number. . Why Reporting Matters to Board Members. The intention of this metric is to identify inefficiencies and wasteful spending. About the Sponsor.
There’s no wrong way to dig into our annual Benchmarks Study, covering digital programs from marketing to fundraising to advocacy. Some folks head straight to mrbenchmarks.com , exploring the full data set and following their own path down the rabbit hole of charts and findings. 2020 M+R Benchmarks Study—A Data Odyssey: The Recording.
Pack your bags, lock your tray table, and fasten your seatbelt: the 2022 M+R Benchmarks Study is ready for takeoff. We’ve put a year’s worth of data from 187 amazing nonprofit partners through the X-ray machine, and we’re ready to take you on a tour of digital ads, social media, email, web traffic, and more. .
According to the 2019 Blackbaud Charitable Giving Report , online giving grew 6.8% It’s also worth noting that according to the Global Trends in Giving Report , 10% of donors worldwide prefer to give directly through their bank account. per month – or $425 a year, according to the Blackbaud Luminate Online BenchmarksReport.
The great thing about email fundraising is that you get quick results and a lot of data to make sense of those results. Donation page conversion rate: This data point represents the total number of donations you received divided by the number of donation pages, multiplied by 100. Was the call to action obvious enough in the email?
Based upon data gleaned from the 2017 Global NGO Online Technology Report , this webinar will highlight how NGOs worldwide use the internet to build awareness and raise funds to advance their mission and programs and elevate their online brand.
Hey data friends, it’s our favorite time of the year, the birds are singing, the flowers are blooming, you can sip your iced coffee outside and read Benchmarks ! So here’s your action item: If your organization hasn’t already, save any existing UA data before this date for historical tracking! We’ll wait. Ok, back with us?
According to the 2022 M+R BenchmarksReport , nonprofits pay an average of $3.31 The ACLU has had a donation form featured at the top of their homepage for almost a year and while there is no public data on its performance, the form must be performing well or it would have been removed months ago. to secure a lead [i.e.,
What the Data Says Many nonprofit organizations build their websites based on hunches about what they think their unique audiences want to see. While its true you know your audience better than anyone, you can greatly increase your websites return on investment (ROI) by taking a data-driven design approach.
Meta has not announced how much is being raised through Instagram Charitable Giving Tools, but according to nonprofit fundraisers that have participated in the Open Data Project , the tools thus far have not been successful for fundraising. Instagram Feed Fundraisers will change that. To begin, sign up for Charitable Giving Tools.
Once again, it’s time for annual reporting! Are you ready to level up your annual report to highlight the true value of your association? Learn how to refine your annual report to reflect your staff’s hard work and your organization’s accomplishments. A call to action. For example, did membership increase this year?
2) Write and distribute quarterly Impact Reports. . According to the Fidelity Charitable Overcoming Barriers to Giving Report , 65% of donors would give more if they knew the impact of their donations. Why Quarterly Impact Reports? Quarterly Impact Reports enhance your website, email, and social media content strategy.
The 12th edition of the Blackbaud Peer-to-Peer BenchmarkReport is here! This report compares peer-to-peer (P2P) fundraising data from 2020, 2021, and 2022. So, we were curious: What would the data tell us about three key questions? So, we were curious: What would the data tell us about three key questions?
Candid’s 2022 Nonprofit Compensation Report can help fill in the gaps when it comes to benchmarking compensation. The report captures the most authoritative and accurate executive compensation data from close to 88,000 nonprofits based on IRS data for fiscal year 2020. . The Pay Gap . Conclusion .
Last week Candid hit a milestone, launching our biggest, most robust nonprofit compensation report yet. Featuring 40% more compensation data compared to last year’s report on 14 top leadership positions—including CEO, CFO, and more. These are just a few highlights from a report rich with key data and details.
Every Nonprofit Needs One, But What’s Really Needed in Your Nonprofit’s Annual Report? So, you’re one year into the adventure of starting your own nonprofit and now the time has come to put together your first annual report. What is an annual report? . What information should you include in your annual report?
Previously, the stunning intelligence gains that led to chatbots such ChatGPT and Claude had come from supersizing models and the data and computing power used to train them. Nvidia unveiled the new GPUs in March 2024 and quickly sold its entire 2024 supply to the largest data center operators. Read more about Nvidia , honored as No.
Based upon data gleaned from the 2018 Global NGO Online Technology Report (to be released January 29) this webinar will highlight how NGOs worldwide use the internet to build awareness and raise funds to advance their mission. Attendees will gain insight by learning benchmarks for success based on NGOs across six continents.
By Josh Kashorek , Director of Marketing at Journity , and advocate for using data to create high-performance nonprofit marketing campaigns. Technology is making it much easier to personalize the donation ask, based on CRM data or other factors, so you can make sure you’re making an ask that is appropriate to the donor. 5) Retention.
We recommend running your campaign for at least a week to get sufficient data before analyzing performance. After a week, review the following data points: 1) CTR (Click-Through-Rate): The CTR is the number of times your ad is clicked on after it is visible on the SERP (search engine results page). Below Keywords, click “Search terms.”
These new channels gave marketers new access to real-time data, requiring more resources to be successful and leading to increased scrutiny of how they were using those resources. In 2009, when I worked at Gaps newly formed digital division, the finance team set benchmarks for success in e-commerce.
It’s now rare to find an executive who doesn't want their organization to be more data driven. Becoming a data-leading company requires not only data and analytics but also a data culture—a way of working that puts data at the heart of every decision. Pairing data and expertise with meaningful business challenges.
Commercial data centers are also transforming to meet the demands of AI and high-performance computing applications. Aligned Data Centers has rolled out next-generation liquid-cooling systems, which use far less water and energy than air cooling, across its operations. in Ehningen, Germany. TSMC had record 2024 annual revenue of $87.8
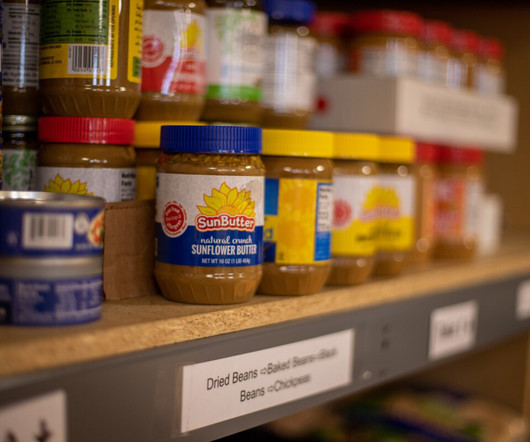
But without the right systems in place, administrative tasks like pulling grant reporting can be time-intensive and error-prone. Your food bank needs accounting software that can help you manage a variety of funding sources while also helping you make strategic, data-driven decisions based on inventory and forecasted community demand.
And how to ingest valuable data for free Photo by Tobias Fischer on Unsplash Data modeling can be a challenging task for analytics teams. Some of the data you need is simplistic, free, and occupies minimal storage. Some of the data you need is simplistic, free, and occupies minimal storage. But fear not!
Comprehensive and public nonprofit demographic data is central to supporting more transparent and informed decision making in our sector. Our purpose at Candid is to get key information—like this demographic data—into the hands of those who rely on it to guide their decision making. nonprofits and foundations.
The 2019 M+R BenchmarksReport observed that for certain nonprofit sectors the impact has been “dramatic,” and for health nonprofits, in particular, it appeared “nothing short of transformative.”. Basic promotion can be as simple as a monthly Facebook post that reports how much Fundraisers have brought in recently for your nonprofit.
The latest edition of the annual M+R Benchmarks Study has arrived, and here’s your ticket to ride. This year, 225 wonderful nonprofits partners joined in the fun, contributing data on fundraising, advocacy, engagement, mobilization, and marketing. The 2024 M+R Benchmarks Study is here! Sign up now! RSVP for either party here!
We organize all of the trending information in your field so you don't have to. Join 12,000+ users and stay up to date on the latest articles your peers are reading.
You know about us, now we want to get to know you!
Let's personalize your content
Let's get even more personalized
We recognize your account from another site in our network, please click 'Send Email' below to continue with verifying your account and setting a password.


Let's personalize your content