Remove Benchmark Remove Content Remove Rate Remove Trend
article thumbnail

Benchmarks 2024 — the Food Bank Edition

M+R

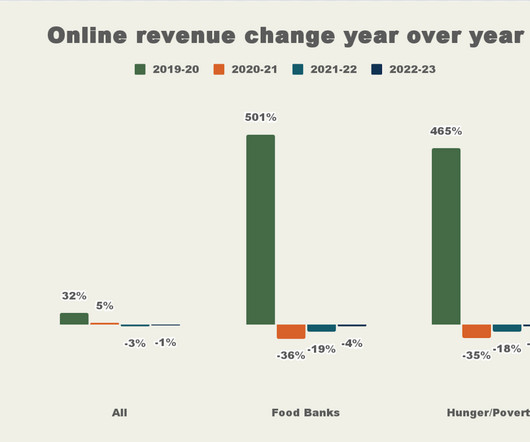
This year, a record 27 regional food banks participated in M+R’s annual Benchmarks Study covering mostly digital fundraising, marketing, advertising, and advocacy metrics (and here’s another plug…if you haven’t dug into this year’s study, do it now!). This year for the first time, we’re sharing the Food Bank Edition of Benchmarks publicly!

article thumbnail

Blackbaud Luminate Online® Benchmark Report Highlights

sgEngage

The 16th annual Blackbaud Luminate Online Benchmark Report is here! It’s a reliable touchstone to identify giving trends as well as shifts in sustainer and email engagement in the nonprofit digital space. Unsubscribe rates did not change much. We look forward to this report every year.

professionals

Sign Up for our Newsletter

This site is protected by reCAPTCHA and the Google Privacy Policy and Terms of Service apply.

article thumbnail

2024 Social Media Statistics for Nonprofits

Nonprofit Tech for Good

Rival IQ Social Media Industry Benchmark Report ] Nonprofits have an average engagement rate of 0.066% on Facebook. Rival IQ Social Media Industry Benchmark Report ] 53% of nonprofits spend on social media advertising. M+R Benchmarks Report ] Facebook/Meta results in an average return on ad spend (ROAS) of $0.48

article thumbnail

2023 Website Statistics for Nonprofits

Nonprofit Tech for Good

Website Builder Expert ] 58% of nonprofits use WordPress.org as their content management system (CMS) for their website (7% use Wix, 6% use Squarespace, and 5% use Drupal). M+R Benchmarks ] Organic traffic (website traffic generated by unpaid search results) comprised 38% of all nonprofit website visits in 2022. [ per visitor. [

article thumbnail

10 Emerging Trends in Online Communications and Fundraising to Watch in 2018

Nonprofit Tech for Good

billion by 2021 – a growth rate of 22%. Due to the decline in reach on social media, nonprofits should prioritize email communications and fundraising in 2018 [ Benchmarks for Success ]. In the 1990’s, English made up 80% of web content. Today, 10 languages make up 82% of web content. 2017 Global Trends in Giving Report.

Trend 268
article thumbnail

Don’t be Fooled by Message Open and Click-Through Rates

NetWits

The conversation around email performance is wrong: open and click-through rates alone do not show constituent engagement. In a couple of weeks, the 2013 Blackbaud Online Marketing Benchmark Study will be released (previously the Convio Online Marketing Benchmark Study ). To the strategic services team, it’s our bible.

Rate 139
article thumbnail

12 Key Digital Engagement Trends from the 2018 M+R Benchmarks Report

Everyaction

The annual M+R Benchmarks Report has arrived again, shining a light on trends that are shaping nonprofits’ digital programs. Having shared and discussed this year’s Benchmarks Report with many of our partners, here’s twelve key trends that have resonated strongly within the EveryAction community.