This site uses cookies to improve your experience. To help us insure we adhere to various privacy regulations, please select your country/region of residence. If you do not select a country, we will assume you are from the United States. Select your Cookie Settings or view our Privacy Policy and Terms of Use.
Cookie Settings
Cookies and similar technologies are used on this website for proper function of the website, for tracking performance analytics and for marketing purposes. We and some of our third-party providers may use cookie data for various purposes. Please review the cookie settings below and choose your preference.
Used for the proper function of the website
Used for monitoring website traffic and interactions
Cookie Settings
Cookies and similar technologies are used on this website for proper function of the website, for tracking performance analytics and for marketing purposes. We and some of our third-party providers may use cookie data for various purposes. Please review the cookie settings below and choose your preference.
Strictly Necessary: Used for the proper function of the website
Performance/Analytics: Used for monitoring website traffic and interactions
The 2011 donorCentrics Internet and Multichannel Giving Benchmarking Report provides analysis of 28 major nonprofit organizations and transactions for over 15 million donors and more than $1 billion in revenue. The dominate giving channel for new donors 64 years old and younger is online — not offline.
A few months ago we published the 2011 donorCentrics Internet and Multichannel Giving Benchmarking Report and yesterday we released the 2011 Online Giving Report. The majority of giving still comes from offline channels, but online fundraising continues to be a significant source for acquiring new donors.
FurMark developer Geeks3D will release the latest version of the popular benchmarking software later this month. The public release should follow the latest beta milestone, v2.0.10, which dropped via the Geeks3D Discord channel on August 27. Read Entire Article
They key to raising more money is to figure out how to utilize offline and online channels together. When you do them both well you have an opportunity to increase overall giving per donor by up to 3X that of a single channel donor. 2011 donorCentrics Internet and Multichannel Giving Benchmarking Report.
Although the findings of the recently released 2011 donorCentrics Internet and Multichannel Giving Benchmarking Report haven’t changed much since the last edition three years ago, its release has (re)fueled the conversation fire in the #nptech community. It’s a great guide for making the most of your channel-surfing donors.
Intel rebranded the Pentium to be known as the "Intel 300," but gaming benchmarks published by YouTube channel PC Watch suggest that its performance is just as underwhelming as that of the older Pentium chip. The channel tested multiple games with the new CPU and found it unable to match. Read Entire Article
There’s no wrong way to dig into our annual Benchmarks Study, covering digital programs from marketing to fundraising to advocacy. Others prefer a sense of community and the chance to ask questions, and a few hundred of them joined us for a Benchmarks webinar yesterday. . Audiences grew across all digital channels. Check it out.
The annual M+R Benchmarks Study is a tasty fusion of digital fundraising, advocacy, and marketing data. Across channels and platforms, we end up with answers about what is working and what’s not, trends in nonprofit strategies, and insight into supporter behavior. And reach out to benchmarks@mrss.com if you have any questions!
Direct mail was the second most preferred channel at 21%, followed by social media (17%), text messaging (8%), and phone calls (2%). M+R Benchmarks ] Online Giving The average gift made on desktop devices is $194; for mobile users, the average gift is $94. [ M+R Benchmarks ] Monthly giving accounts for 28% of all online revenue. [
The annual M+R Benchmarks Study is a wide-ranging exploration of digital fundraising, advocacy, and marketing data. Across channels and platforms, we end up with answers about what is working and what’s not, trends in nonprofit strategies, and insight into supporter behavior. . Related Links: Benchmarks UK is here! Sign up now
We are excited to report that the 2021 M+R Benchmarks Study is ready for you. Thanks to contributions from 220 amazing nonprofit participants, this year’s Benchmarks Study covers detailed data including digital ads, social media, email, web traffic, mobile messaging, and more. . Audiences grew across all digital channels.
Hoping to hop on the 2022 Benchmarks train? This Friday (December 3) is the last day to sign up to be part of the next Benchmarks journey ! And please reach out to benchmarks@mrss.com with any questions. The annual M+R Benchmarks Study is a wide-ranging exploration of digital fundraising, advocacy, and marketing data.
Intel revealed the Arc A750 benchmarks for 48 games in a new video on its YouTube channel. Forty-two of these are DirectX 12 titles that include Red Dead Redemption 2 and Assassin's Creed Valhalla, while six are Vulkan games such as Doom Eternal and Ghost Recon Breakpoint. Intel insists that none were cherry-picked.
I remember thinking to myself at the time, well if one networked nonprofit can do this, couldn’t a network of networked nonprofits use real-time collaborative benchmarking data sharing for learning? Number of followers has become a benchmark stat like the number of hits on our web pages used to be.
Even though December is a universally-accepted annual benchmark that signifies conclusion, certain sectors have their own benchmarks that they count on for donation surges. For example, June serves as the annual benchmark for educational sectors, as it denotes the academic year’s end. Non-December Surges.
YouTube channel HDTVTest was the first to highlight a potential cheating issue in Samsung's S95B QD-OLED TV. It appears this wasn't an isolated incident as FlatpanelsHD found the same discrepancy on the Samsung QN95B Neo QLED LCD TV.
Yet one of the most striking findings in our 2011 donorCentrics Internet and Multichannel Giving Benchmarking Report was that, in aggregate, online-acquired donors still have much higher cumulative value over the long term than traditional, mail-acquired donors. The Importance of Moving Donors Offline.
I was curious about what I could learn if I did an informal benchmark study of a few nonprofit Pinterest users. Have you benchmarked this data against other similar types of nonprofits? Rick Kats kindly sent me a spreadsheet of metrics for 6 nonprofits that were early adopters, using it consistently and best practices.
While a large majority of donations are still made by check (79 percent), online fundraising is the fastest growing donation channel. – eNonprofit Benchmark study. 13% – eNonprofit Benchmark Study. Online fundraising grew 34% and raised over $20 billion dollars in 2010 – Blackbaud. The average 1x donation is $60.00.
A benchmarking process can be as simple as finding a handful of similar nonprofit organizations and comparing your key performance metrics. Take this example comparing nonprofits performance in pinerest. Or you may use a sector wide benchmarking study such as the NTEN Social Networking Benchmarking Study. By: Rebecca Shore.
According to the 2020 Benchmarks Data from M+R , overall online giving revenue increased by 10% in 2019, and revenue from monthly gifts increased by 22%. Use a multi-channel approach. For any fundraising campaign, you’ll see the best results from using every channel available to you.
1) Multi-Channel Strategy Employing a multi-channel strategy helps nonprofits reach a wider audience with their year-end campaign. Online channels (email, social media, website, donation forms, and texting) encourage real-time interactions, personalized messaging, and taps into tech-savvy younger donors.
Later, the advent of new marketing tactics and an increased focus on social channels thrust marketers into the spotlight in a way they hadnt been before. These new channels gave marketers new access to real-time data, requiring more resources to be successful and leading to increased scrutiny of how they were using those resources.
Nonprofit email benchmarks are more than interesting data points. Comparing your own performance to industry benchmarks can help you identify areas to improve your email strategies. These benchmarks are based on the performance of 37,472 individual email campaigns sent by Neon One clients in 2022. Thats okay! Sign me up!
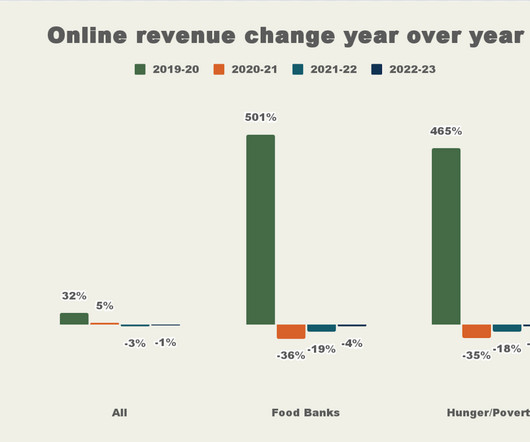
This year, a record 27 regional food banks participated in M+R’s annual Benchmarks Study covering mostly digital fundraising, marketing, advertising, and advocacy metrics (and here’s another plug…if you haven’t dug into this year’s study, do it now!). This year for the first time, we’re sharing the Food Bank Edition of Benchmarks publicly!
At these times I can really relate to direct mail specialists, who’ve dealt with their channel being out of vogue for a decade. So I’ve been extremely gratified to see the buzz surrounding Blackbaud’s 2011 donor Centrics Internet and Multichannel Giving Benchmark Report. The report, which covers 15.6 million donors and more than $1.16
The deadline to join the 2023 Benchmarks Study is THIS Friday, December 2. The annual M+R Benchmarks Study is a tasty fusion of digital fundraising, advocacy, and marketing data. We hope you’ll join us and participate in our upcoming 2023 M+R Benchmarks. And reach out to benchmarks@mrss.com if you have any questions!
So what’s the harm in dropping a channel? It’s become increasingly common for new donors to give their first gift online, but without a strategy to move these new donors to an offline cultivation channel you’ll miss out on a significant increase in fundraising revenue. It sure would save a lot of time and money.
Donor Movement Across Channels. Watching this growth in online giving, combined with the steady performance in offline giving, can cause nonprofits to mistakenly believe that donors are seamlessly flowing between channels. Follow-ups to offline donors, meanwhile, should still be designed to retain giving in that channel.
We studied 778 nonprofit organizations’ video posts on Facebook, Twitter and Instagram from January 1, 2019 – December 31, 2019 to establish benchmarks, identify trends, and uncover insights. We analyzed the Top 100 Most Engaging Nonprofit Videos Per Channel and found that the most engaging content types were: Animals, kids & cuteness.
The latest edition of the annual M+R Benchmarks Study has arrived, and here’s your ticket to ride. Total advertising investment — including both digital and non-digital channels — increased by 13%. About half of M+R Benchmarks participants reported working with social media influencers in 2023. Sign up now!
Your content strategy thus far has focused on what types of content your nonprofit plans to create and what channels it will use to distribute the content. Marketing is the strategic use of content and communication channels for direct gain. The following is an excerpt from Mobile for Good: A How-To Fundraising Guide for Nonprofits.
With updated benchmarks, you’ll have a roadmap to guide your campaign and keep your team focused. And don’t rely on just one channel; emails, social media posts, and direct mail all play a part in meeting donors where they are. To keep their attention, you’ll need to meet them across multiple channels.
The company says that more than 30,000 tech companies are already sharing their data to generate the benchmarks, although it keeps names of the specific companies participating anonymous and private. Compass builds upon the benchmarking that was previously available to contributors to Startup Genome.
The average nonprofit website has a 1% conversion rate ( according to the M+R Benchmarks report ) and this means that 99% of the people you get to visit your website leave without donating or subscribing to your email list. At the end of the day though, making small changes to your forms or calls-to-action can drive big gains.
Last month we reported that online fundraising response rates declined 27% between 2011-2012, according to the eNonprofit Benchmark study. The latest Blackbaud Online Marketing Benchmark Study for Nonprofits that analyzed data from 500 organizations using the Luminate platform also indicated a steep decline in fundraising response rates.
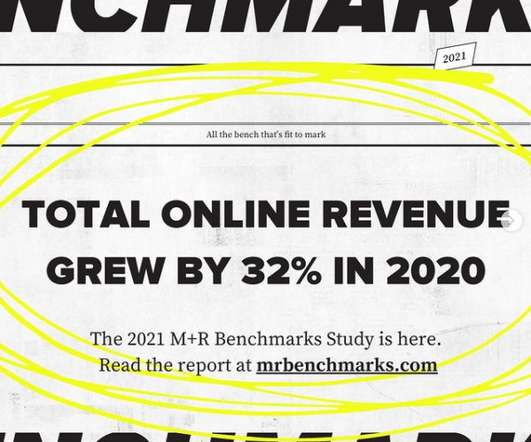
Every year, nonprofit consultants M+R release their annual Benchmarks report , which provides an overview of digital trends in the sector. The big sound bite from this year’s Benchmarks Report is that total online revenue grew by only 1% in 2018. Online revenue growth has plateaued. What’s the state of your monthly giving program?
The worrying news comes from the GameGPU YouTube channel (via DSOGaming). The in-game benchmark has it averaging around 56 fps, though some sections fall as low as 40 fps. It appears to show Valhalla running on Nvidia’s Ampere flagship paired with a Core i9-10900K.
Email is still a major component of organizational communication and a channel used by nonprofit supporters and donors; it is critical that it grows and develops to match the changing ways we use it and share messages. You can download them now for free.
Below are a few suggestions for ways to recognize constituent’s efforts: Create recognition opportunities for reaching key benchmarks, such as size of team, number of event recruits, and amount of money raised. Utilize naming opportunities to recognize above described benchmarks. Saying Thanks.
Benchmarking. Making information readily available to staff members keeps communication channels open and welcoming to questions and feedback about the new service. After the technology has been added to your organization’s daily workflow, take some time and gain feedback from your staff. What would make adoption easier?
The annual M+R Benchmarks Report has arrived again, shining a light on trends that are shaping nonprofits’ digital programs. Having shared and discussed this year’s Benchmarks Report with many of our partners, here’s twelve key trends that have resonated strongly within the EveryAction community. Mobile list size grew by 35% in 2017.
They expanded their audience reach and tried new channels. We saw in our 2024 Benchmarks study that the median nonprofit was sending only 7.7 Audio and CTV Maybe youre already optimized in the traditional ads channels, (social, display, and search) and want to take the next step. What do we mean by make the most of it?
Actually, it’s single channel communication that’s dead. Donors Flip Channels Dunham+Company has new data out in “A National Survey of the Impact of Offline Communication on Online Donations.&# Donors flip channels. The key for nonprofits is to focus on the experience a donor has when they switch channels.
We organize all of the trending information in your field so you don't have to. Join 12,000+ users and stay up to date on the latest articles your peers are reading.
You know about us, now we want to get to know you!
Let's personalize your content
Let's get even more personalized
We recognize your account from another site in our network, please click 'Send Email' below to continue with verifying your account and setting a password.


Let's personalize your content