5 Takeaways From M+R’s Online Fundraising ‘Benchmarks’
NonProfit PRO
APRIL 30, 2024
M+R's annual “Benchmarks” report revealed five key takeaways on nonprofits' digital fundraising strategies.
This site uses cookies to improve your experience. To help us insure we adhere to various privacy regulations, please select your country/region of residence. If you do not select a country, we will assume you are from the United States. Select your Cookie Settings or view our Privacy Policy and Terms of Use.
Cookies and similar technologies are used on this website for proper function of the website, for tracking performance analytics and for marketing purposes. We and some of our third-party providers may use cookie data for various purposes. Please review the cookie settings below and choose your preference.
Used for the proper function of the website
Used for monitoring website traffic and interactions
Cookies and similar technologies are used on this website for proper function of the website, for tracking performance analytics and for marketing purposes. We and some of our third-party providers may use cookie data for various purposes. Please review the cookie settings below and choose your preference.
 Benchmark Related Topics
NonProfit PRO
APRIL 30, 2024
M+R's annual “Benchmarks” report revealed five key takeaways on nonprofits' digital fundraising strategies.
NonProfit PRO
JULY 8, 2021
We’re going to review the Facebook Fundraising Benchmarks Report 2020 by GivePanel. Let’s clarify what “Facebook fundraising” refers to. It’s probably exactly what you think it is: when someone on Facebook starts a fundraiser to support your nonprofit. But there’s some fine print here.
This site is protected by reCAPTCHA and the Google Privacy Policy and Terms of Service apply.
NonProfit PRO
APRIL 7, 2023
ASI has released the results of its global 2023 Membership Performance Benchmark Survey. The eigth annual survey, conducted in late 2022, examines membership trends, including recruiting, retention, and engagement.
NonProfit PRO
NOVEMBER 8, 2023
Nonprofits are at a pivotal transformation point and are focusing on their long-term strategic resilience following a few years of readily available federal funding, according to BDO’s seventh annual "Nonprofit Standards" benchmarking survey.

NonProfit PRO
MAY 4, 2023
Shortly after the nonprofit sector learned that both overall donors and donor dollars had declined, M+R confirmed the downward trends with M+R Benchmarks 2023, noting a 4% median decline in year-over-year online revenue for nonprofits.

NonProfit PRO
MAY 5, 2022
One of my favorite statistics were just published: the M+R Benchmarks 2022. Not surprisingly, in the second year of the pandemic with still few in-person events, online giving grew, although not by as much as you’d expect.

NonProfit PRO
OCTOBER 7, 2024
Virtuous released its "Nonprofit Fundraising Benchmark Report," providing insight into the seven KPIs that drive nonprofits' growth.

NonProfit PRO
JUNE 10, 2021
The 2021 Nonprofit Leaders Survey is designed to elicit candid feedback on the trends, outlooks and greatest challenges nonprofits are facing today and provide valuable benchmarking data to help nonprofit leaders uncover the greatest areas of opportunity and growth in the wake of the COVID-19 crisis.

NonProfit PRO
JUNE 21, 2021
Download the benchmark study for an in-depth look at 157 GivePanel charities across the US, UK, and Ireland. Knowing the different types of fundraising and donations that can happen is a scary task. Check out our 9 Key Findings on Facebook Fundraising to help you get these difficult questions answered.

Whole Whale
SEPTEMBER 25, 2024
To view it please enter your password below: Password: The post Protected: 2024 Nonprofit Advertising Benchmark Study appeared first on Whole Whale. This content is password protected.

NonProfit PRO
FEBRUARY 16, 2023
Industry benchmarks reveal just 23% of first-time online donors return, compared to 64% of existing online donors. And over the last decade, nonprofits have continued to raise more funds from fewer donors. These statistics underscore the importance of not only keeping your donors, but also acquiring new ones

Charity Village
MAY 30, 2024
The 2024 Canadian Direct Mail Benchmarks report is here! This year’s report is made possible by 49 amazing participating charities who shared their […] The post Good Works released the 2024 Direct Mail Benchmarks report appeared first on CharityVillage.
M+R
APRIL 29, 2024
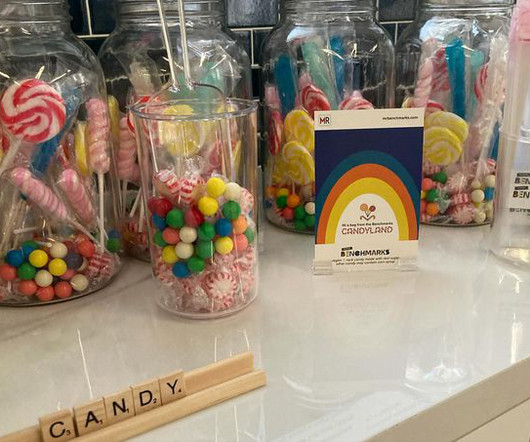
We launched our latest Benchmarks report last week and, as promised, it was a candyland of useful information about digital ads, email, mobile messaging, social media, web performance, and more (also, there was a real candyland at the launch party!). If you missed it, no need to be SORRY…. RSVP here !
M+R
OCTOBER 20, 2022
The annual M+R Benchmarks Study is a tasty fusion of digital fundraising, advocacy, and marketing data. We hope you’ll join us and participate in our upcoming 2023 M+R Benchmarks. Each edition of M+R Benchmarks is only as good as our ingredients — the more nonprofits who sign up, the more reliable and thorough the final study will be.

Charity Village
JULY 17, 2024
Use it to show off your success, […] The post Have you had a chance to download and dig into Direct Mail Benchmarks 2024 yet? If you’ve been wondering how your fundraising measures up against other charities in the nonprofit sector, this is the report for you. appeared first on CharityVillage.

M+R
APRIL 27, 2023
The maître d’ has called your name, the table is set, and the napkins are folded up like fancy little swans: it’s time to dig in to a year’s worth of M+R Benchmarks charts, findings, and insights at mrbenchmarks.com ! The 2023 M+R Benchmarks Study is served! Sign up for the webinar now. The post Come and get it!
Nonprofit Tech for Good
MARCH 20, 2024
M+R Benchmarks ] Online Giving The average gift made on desktop devices is $194; for mobile users, the average gift is $94. [ M+R Benchmarks ] 25% of online donations were made on a mobile device in 2022. [ M+R Benchmarks ] 30% of all online giving occurs in December and 10% occurs in the last three days of the year.

Tech Soup
JANUARY 20, 2023
Between June and September of 2022, TechSoup, in partnership with the digital marketing and technology agency Tapp Network, built the Nonprofit Digital Marketing Benchmark Survey. We compared the findings to those gathered in the 2020-2021 Nonprofit Digital Marketing Benchmark Survey and Report.

NonProfit PRO
JANUARY 22, 2024
Download the report to glean insights from 939 fundraising professionals, benchmark your nonprofit's success, see where other nonprofits plan to invest their budget, learn how the nonprofit sector feels about AI, and more.

M+R
NOVEMBER 29, 2021
Hoping to hop on the 2022 Benchmarks train? This Friday (December 3) is the last day to sign up to be part of the next Benchmarks journey ! And please reach out to benchmarks@mrss.com with any questions. The annual M+R Benchmarks Study is a wide-ranging exploration of digital fundraising, advocacy, and marketing data.

M+R
OCTOBER 15, 2021
The annual M+R Benchmarks Study is a wide-ranging exploration of digital fundraising, advocacy, and marketing data. We’d like to invite you to come along by participating in our upcoming 2022 M+R Benchmarks. . The window to sign up as a Benchmarks participant is open NOW. Related Links: Benchmarks UK is here!

M+R
APRIL 28, 2022
You might be feeling a little of that frustration and FOMO if you missed the M+R Benchmarks webinar on April 27, but don’t worry — we would never leave you behind. . Finally, what would a journey like Benchmarks be without a custom roadtrip mixtape? The full webinar recording is available here.
NonProfit PRO
JANUARY 19, 2023
TechSoup and Tapp Network released the results of the 2022-2023 Nonprofit Digital Marketing Benchmark Report, which reveals the strategies used by over 100 nonprofits in 2022 and their plans for improvement in 2023.
M+R
APRIL 22, 2021
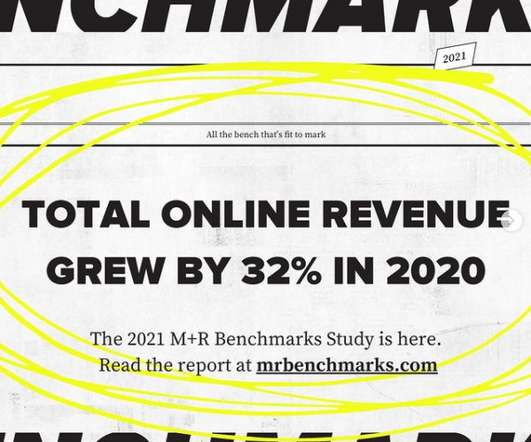
We are excited to report that the 2021 M+R Benchmarks Study is ready for you. Thanks to contributions from 220 amazing nonprofit participants, this year’s Benchmarks Study covers detailed data including digital ads, social media, email, web traffic, mobile messaging, and more. . 2021 Benchmarks UK FAQ. 2021 Benchmarks UK FAQ.

NonProfit PRO
AUGUST 11, 2022
Recent donorCentrics Sustainer Benchmarking studies show that some 6% of monthly donors will make at least one extra gift a year when asked, so not asking is definitely leaving money on the table. Here's how to go about it.

NonProfit PRO
DECEMBER 8, 2023
Our CIS Hardened Images® come pre-hardened to the security recommendations of the CIS Benchmarks™. Need to strengthen you public sector organization's cloud security? They help you defend against cloud-based threats for just $0.02 per compute hour.
M+R
APRIL 27, 2022
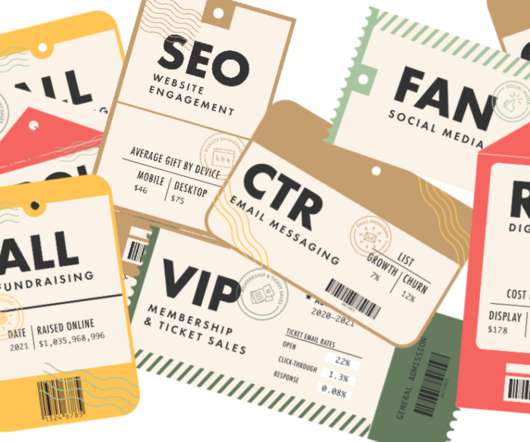
Pack your bags, lock your tray table, and fasten your seatbelt: the 2022 M+R Benchmarks Study is ready for takeoff. The full 2022 Benchmarks Study is waiting for you to explore right now (or download as a pdf so you can still check it out while in airplane mode). Go explore the findings, charts, and analysis at mrbenchmarks.com. .

NonProfit PRO
APRIL 3, 2024
The “2024 Digital Fundraising Benchmark Report” explored how a digital-first approach affected fundraising. Here are three takeaways.

M+R
APRIL 16, 2024
Hey data friends, it’s our favorite time of the year, the birds are singing, the flowers are blooming, you can sip your iced coffee outside and read Benchmarks ! TLDR: What’s going on with website data in Benchmarks The transition from UA to GA4 happened mid-year in 2023 (and with it, all of the changes to tracking between the two systems).

NonProfit PRO
APRIL 12, 2023
The new report provides a look at nonprofit email benchmarks for both large and small organizations. With data from nearly 1,500 nonprofits, nonprofit software provider Neon One has evaluated more than 37,000 email campaigns totaling more than 157 million individual emails for “The Nonprofit Email Report.”
Nonprofit Tech for Good
JULY 4, 2023
M+R Benchmarks ] Organic traffic (website traffic generated by unpaid search results) comprised 38% of all nonprofit website visits in 2022. [ M+R Benchmarks ] The top three sources of website traffic are: Direct (22%) Organic Search (17%) Social (16%). M+R Benchmarks ] Average online gift and mobile giving. per visitor. [
NonProfit PRO
JUNE 6, 2024
Download now to access benchmarks, donor insights, data-backed strategies, and advice from industry fundraising experts. Recurring donors are easy to retain, highly engaged, and deeply connected to the causes they love. If you want to expand your recurring giving program, this resource is for you.

sgEngage
MARCH 8, 2024
The 16th annual Blackbaud Luminate Online Benchmark Report is here! When looking at online benchmarks and digital revenue, we saw that any growth or ground held was due to increases in sustainer metrics. Putting Benchmarks into Action What does all this mean for nonprofit marketers and fundraisers?

Nonprofit Tech for Good
JULY 21, 2019
Email messaging drives 13% of all online revenue ( M+R Benchmarks Report ). For every 1,000 fundraising messages delivered via email, nonprofits raise $45 USD ( M+R Benchmarks Report ). Nonprofits sent an average of 59 email messages per subscriber in 2018 ( M+R Benchmarks Report ). M+R Benchmarks Report ).

NonProfit PRO
NOVEMBER 9, 2022
Despite a year of global economic turmoil characterized by inflation and the looming possibility of a downturn, nonprofits not only achieved revenue growth but expanded their impact, according to BDO’s annual Nonprofit Standards benchmarking survey.
NonProfit PRO
MAY 31, 2023
Cherian Koshy of Merit America and Tim Sarrantonio of Neon One join the NonProfit Voice to discuss email benchmarks for the nonprofit sector.

NonProfit PRO
APRIL 7, 2022
Women Business Collaborative (WBC) and 50/50 Women on Boards (50/50WOB) released "Women Leading Boards," a new benchmark report for tracking board diversity. The report shows that 2021 was a watershed year for board diversity, with women representing 42.5% of all new appointees for public companies in the U.S. in 2021.
Nonprofit Tech for Good
MAY 7, 2024
Rival IQ Social Media Industry Benchmark Report ] Nonprofits have an average engagement rate of 0.066% on Facebook. Rival IQ Social Media Industry Benchmark Report ] 53% of nonprofits spend on social media advertising. M+R Benchmarks Report ] Facebook/Meta results in an average return on ad spend (ROAS) of $0.48 on TikTok. [
Nonprofit Tech for Good
MARCH 31, 2021
It’s worth noting that in the survey the questions about website communications are only presented to those that have working knowledge in nonprofit website management, thus ensuring that the data is sound to use as benchmarks in your nonprofit’s website communications strategy. 6% use Wix. 5% use Squarespace.

Nonprofit Tech for Good
APRIL 18, 2017
Source: 2016 Luminate Online Benchmark Report. Source: 2017 Benchmarks Study. In 2016, the number was 28%, which is a 40% jump from 2015. Source: Dunham+Company. Sustainer income from monthly donors grew 10% in 2016. Source: 2016 Donor Loyalty Study. Source: 2017 Global NGO Online Technology Report.
Expert insights. Personalized for you.
We have resent the email to
Are you sure you want to cancel your subscriptions?

Let's personalize your content