This site uses cookies to improve your experience. To help us insure we adhere to various privacy regulations, please select your country/region of residence. If you do not select a country, we will assume you are from the United States. Select your Cookie Settings or view our Privacy Policy and Terms of Use.
Cookie Settings
Cookies and similar technologies are used on this website for proper function of the website, for tracking performance analytics and for marketing purposes. We and some of our third-party providers may use cookie data for various purposes. Please review the cookie settings below and choose your preference.
Used for the proper function of the website
Used for monitoring website traffic and interactions
Cookie Settings
Cookies and similar technologies are used on this website for proper function of the website, for tracking performance analytics and for marketing purposes. We and some of our third-party providers may use cookie data for various purposes. Please review the cookie settings below and choose your preference.
Strictly Necessary: Used for the proper function of the website
Performance/Analytics: Used for monitoring website traffic and interactions
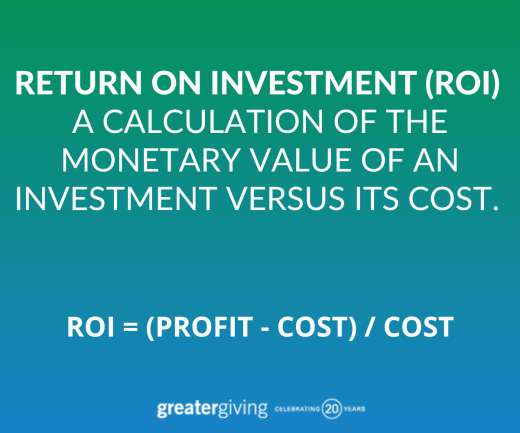
4) Data Analytics Will Help Optimize Fundraising Data is a powerful tool for nonprofit event planners. Using a golf event management software allows nonprofits to seamlessly collect and responsibly manage tournament data and track metrics like registration trends, fundraising progress, and sponsorship ROI.
Set Clear, Measurable Goals: Define success metrics that are specific, actionable, and adaptable as your association grows and evolves. How.orgSource Can Help: We work with associations to create actionable, future-focused strategies that align with industry trends and member needs, ensuring your vision is resilient and achievable.
Any time you see an impressive Google Grant case study , the metrics are always made possible through conversion tracking. . Conversion Tracking for the Google Grant is made possible by two free tools for nonprofits: Google Analytics and Google Tag Manager. We want to make sure that Google Analytics is linked to Google Ads.
The Past Is Not Always Prologue On its face, it can make a lot of sense to look at what has worked, and continue doing that. What worked last year will likely be relevant to the interests of your members next year. Data can tell you what works much more than just the whims and musings of a longtime executive or board member.
The key to building a digital strategy that works is DATA. What social media metrics matter for your nonprofit. Understand what’s already working and dial it up! << Did you scroll through content on Instagram today? Or maybe watch a live video on Facebook?
Set Clear Goals and Metrics : Define what success looks like in terms of member engagement, satisfaction, and retention. Track these metrics over time to adjust your strategy as needed. Empower Cross-Functional Collaboration : Create opportunities for different teams to work together on shared goals.
Limited Use of Data and Analytics In an increasingly data-driven world, the ability to gather, analyze, and act on data is a key differentiator. Data analytics can help you anticipate changes and adapt proactively. Our team designs innovative, tech-forward campaigns to help associations connect with members in meaningful ways.
Measuring Training Effectiveness with LMS Analytics Gyrus Systems Gyrus Systems - Best Online Learning Management Systems Introduction Companies use Learning Analytics Tools to collect, analyze, and measure the effectiveness of their learning and development programs. It helps them know if they are using time and resources wisely.
However, with the right allocation of resources and effective use of analytics, nonprofits can tap into marketing channels and strategies that offer high returns. By tracking the right metrics, you’ll be able to determine what parts of your nonp rofit advertising stra tegy are successful and what needs to be adjusted.
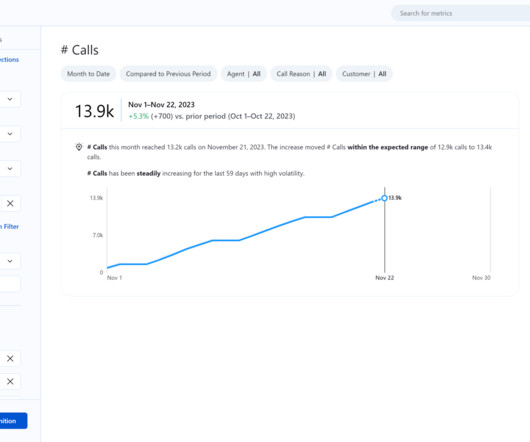
In this blog, we share tips on how to take your marketing to the next level with the help of analytics. These tools help you see how your campaigns are doing in real-time, so you can optimize your marketing budget by spending your money on what’s working best. Association Analytics Tip: Always be deliberate in the data you ask for!
We call these big, beautiful, but often distracting numbers vanity metrics high-level data points that dont point to actual performance and its important to know the appropriate time and place to use them. Getting, shall we say obsessed, with this number may lead to inaccurate or incomplete comparisons.
You probably have a long list of great things you want to accomplish this year…including making analytics a priority. We can help you move analytics to the top of the list by giving you tips to build a business case and how to articulate it to others. Let’s build your business case to make data analytics a top priority: 1.
The team at Association Analytics often hears questions like, What exactly is data analytics? What’s the difference between analytics and reporting? First: Reporting vs. Analytics. With analytics, you try to aggregate data over time and across data sources for a 360-degree view of your members and their activities.
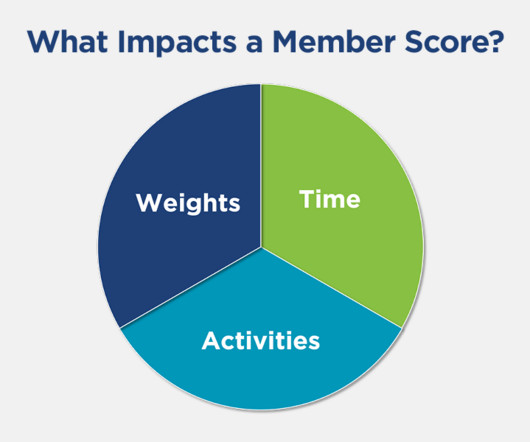
You can glean a lot of insights about your members once you get your association on board with engagement analytics. Every score has a treasure trove of insights you can work with to improve your members’ experience. Next, discuss how often your association will review your engagement analytics data and improve audience targeting.
Especially in associations, analytics can provide invaluable insights, guiding strategies and shaping outcomes. However, the hurdle remains: how do you convince the powers-that-be to earmark a slice of the budget for analytics? By using analytics, they realize that most of their online course engagement happens in the evenings.
Throughout the evaluation process, it’s important to keep your association’s unique goals and success metrics top-of-mind. Third parties are able to staff with top experts that can deliver the work and provide consultation before, during and after implementation. Implementing a new software solution is a huge project.
Invest in creating visually appealing graphics and videos that showcase your work. Here’s how to make it work for you: Identify Relevant Influencers : Find influencers within your niche who are passionate about your cause. Tools like Canva and Adobe Spark offer free templates and editing options to make this process easier.
Tableau has been on a long journey to provide natural language interfaces for analytics. The release of Tableau Pulse introduces some redundancies to the platform, including search-based analytics with Ask Data and Tableau Metrics. One answer is the complexity of data and analytical tools.
Traditional analytics might attribute the entire value to that ad. Feel free to *borrow* because we can’t work with everyone. Implement Proper Analytics Configure Google Analytics 4 properly Set up multi-touch attribution tracking Use consistent UTM parameters Track micro-conversions Monitor cross-channel user journeys 2.
With a modern ecosystem, your association can start by separating out analytical data from transactional data. 8: Your Organization Doesn’t Have KPIs and Metrics Challenge : Without key performance indicators (KPIs) or metrics, your organization is missing out on vital information about your members. Set up your KPI and metrics!
In the last few years, Microsoft has rebuilt LinkedIn working out many of the kinks and bugs that made it frustrating to use, and has launched a suite of new tools and functionality for LinkedIn Pages , Profiles , and Groups. 3) Monitor your LinkedIn Analytics. That changed when LinkedIn was purchased by Microsoft in 2016 for $26.2
By using a handful of metrics that everyone agrees on, you can organize tasks, rally the team, and get everyone focused on the right kind of work. Day-to-day business management is where KPIs can make a difference for your nonprofit.
Alex Circei is the CEO and co-founder of Waydev , a development analytics tool that measures engineering teams' performance. The move to remote working is creating tensions between CEOs and CHROs that could culminate in decisions that are not always in the best interest of the business. Start with DORA metrics.
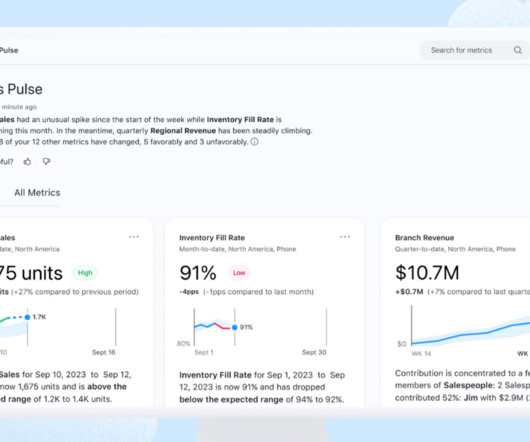
AI is changing everything—from how we work and innovate to the products and services we create for our customers. That’s why it’s never been more essential for companies to create a comprehensive analytics strategy and become data-driven. Tableau Pulse In the past, proficiency in data and analytics required specific skill sets.
Alex Circei Contributor Share on Twitter Alex Circei is the CEO and co-founder of Waydev , a development analytics tool that measures engineering teams' performance. Developer experience is more about how software developers feel about the work they do on a daily basis, and that’s directly influenced by the tools and processes they use.
Today’s question comes from a nonprofit employee who wants advice on whether or not it’s worth it to invest in digital analytics tools. . They want us to invest in digital analytics tools to measure our efforts, but I’m not really sure what this will tell us. The road to digital analytics maturity.
Product Marketing Manager, Embedded Analytics, Tableau. Embedding analytics is a way we can help our customers make smarter decisions and achieve greater success. When creating an embedded analytics offering, the biggest decision is whether to build an in-house solution or purchase a turnkey solution. Clayron “Cj” Pace.
As communications director Melissa Franqui explains, “Any communications department, not only ours, has to be continuously asking, is the site communicating our mission, our current work, and our values to our intended audiences?”. We work quickly to create and disseminate content, and look at metrics on our various digital platforms.
Jobs requiring digital skills, particularly data analytics and visualization, will grow by 10% in the next five years, jumping from 27% to 37%, according to a new IDC Salesforce Economy study. IDC research shows that only 33% of employees are comfortable using data analytics to support their decisions. Product Marketing Manager.
Tableau is a leader in the analytics market, known for helping organizations see and understand their data, but we recognize that gaps still exist: while many of our joint customers already benefit from dbt and trust the metrics that result from these workflows, they are often disconnected and obscured from Tableau’s analytics layer.
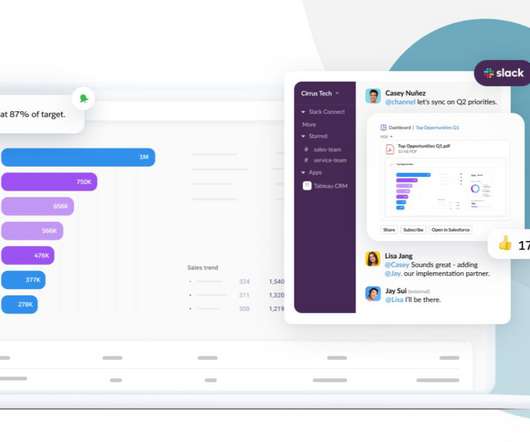
It’s difficult to inject insights within the flow of business, especially with the rise of remote work and distributed teams. That’s why we’re putting analytics into the flow of business. Together, Tableau and Slack broaden the reach of analytics across your organization and help everyone make data-driven decisions faster. .
Mastering an analytic approach to strategy and planning. Master an analytic approach to strategy and planning. That’s why you need an analytic, numbers-based perspective to strategy and planning. It’s a remarkably ineffective way of working for an industry built on numbers. . “We Let’s say you’re a food bank.
Data analytics can be a great unifier for your organization, helping get staff at every level, from the board down to the implementers, align around your important objectives. Of course, first, you must get your organization to evolve and more uniformly embrace data and analytics, which we know can be quite challenging.
You can use tools like surveys, interviews, or data analytics to understand this (more on that below). Study Social Media Analytics Monitor Analytics Diligently This means tracking your website and social media metrics like page views, click-through rates, and the time spent on various sections of your website and social media platforms.
As valuable as data is, though, without a clear and actionable way to track and report across your entire association, it can be difficult to tell what’s actually working. It involves: Defining What to Measure: Identify the specific metrics that align with your strategic goals. Pillar: Membership Growth and Engagement What to track?
Nonprofits are doing important work every day that impacts lives and makes our world even better. Does the platform provide powerful tools for data analysis, insight and built-in reporting for nonprofit metrics? You want to understand who you will be working with during the implementation and after you go-live. Outcomes matter.
You should segment your membership by the metrics that matter most to you, such as demographics, tenure, behavior, at-risk status, periods of time and more. These metrics can help your association learn more about various members, which, in turn, enables you to customize retention efforts for a specific group and boost their engagement.
Product Marketing Manager, Embedded Analytics, Tableau. Embedding analytics is a way we can help our customers make smarter decisions and achieve greater success. When creating an embedded analytics offering, the biggest decision is whether to build an in-house solution or purchase a turnkey solution. . Clayron “Cj” Pace.
A recent Analytics in Action webinar, titled Embracing Data Analytics to Reinvent Your Content Marketing , delved into just this. During the webinar, Association Analytics VP of Strategy and Solutions Bill Conforti emphasized, “We’re talking more about like communications, right?
Use hashtags strategically to mention important causes, campaigns, and events, but hashtag spamming to try to increase your reach doesn’t work and has a negative effect on engagement. From big victories to little wins, focusing on the positive angle of your work is beneficial to your social media content strategy overall.
The metrics you use to measure your progress toward a business objective are key performance indicators (KPIs). What metrics could you use to predict whether you will achieve your goals ? These metrics are called leading indicators. Ready to start your data analytics journey? Develop KPIs for Your Goals.
Many organizations are challenged with scaling analytics to reach every employee and/or realizing the full value of their analytics investments. Organizations are investing trillions to become more data-driven, but only 8% successfully scale analytics to get value from their data, according to McKinsey. .
These key event metrics quantify the success of your events, and can show you how to improve them. Tracking these key event metrics can deliver critical insight into what you’re doing well, and where your events need improvement. So what are those metrics, and what data do you need to track to analyze them? Sponsorship Dollars.
AI is changing everything—from how we work and innovate to the products and services we create for our customers. That’s why it’s never been more essential for companies to create a comprehensive analytics strategy and become data-driven. Tableau Pulse In the past, proficiency in data and analytics required specific skill sets.
We organize all of the trending information in your field so you don't have to. Join 12,000+ users and stay up to date on the latest articles your peers are reading.
You know about us, now we want to get to know you!
Let's personalize your content
Let's get even more personalized
We recognize your account from another site in our network, please click 'Send Email' below to continue with verifying your account and setting a password.


Let's personalize your content