This site uses cookies to improve your experience. To help us insure we adhere to various privacy regulations, please select your country/region of residence. If you do not select a country, we will assume you are from the United States. Select your Cookie Settings or view our Privacy Policy and Terms of Use.
Cookie Settings
Cookies and similar technologies are used on this website for proper function of the website, for tracking performance analytics and for marketing purposes. We and some of our third-party providers may use cookie data for various purposes. Please review the cookie settings below and choose your preference.
Used for the proper function of the website
Used for monitoring website traffic and interactions
Cookie Settings
Cookies and similar technologies are used on this website for proper function of the website, for tracking performance analytics and for marketing purposes. We and some of our third-party providers may use cookie data for various purposes. Please review the cookie settings below and choose your preference.
Strictly Necessary: Used for the proper function of the website
Performance/Analytics: Used for monitoring website traffic and interactions
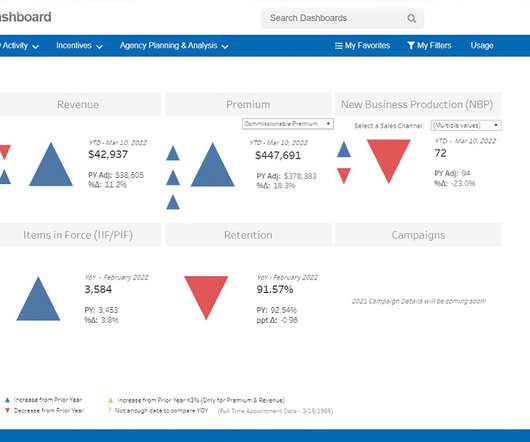
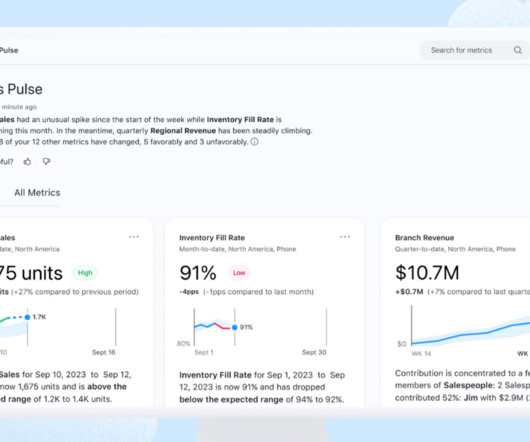
That’s why it’s never been more essential for companies to create a comprehensive analytics strategy and become data-driven. Tableau Pulse In the past, proficiency in data and analytics required specific skill sets. Your personalized Tableau Pulse homepage displays a summary of the key metrics that you follow.
It’s worth noting that Summary with Large Image Cards outperform uploading an image in place of using cards as well as Twitter Cards that pull up a small, square thumbnail image. For example, the @MarshallProj has Summary with Large Image Cards enabled for their website content: 5) Curate good content through retweets.
Today’s question comes from a nonprofit employee who wants advice on whether or not it’s worth it to invest in digital analytics tools. . They want us to invest in digital analytics tools to measure our efforts, but I’m not really sure what this will tell us. The road to digital analytics maturity.
Product Marketing Manager, Embedded Analytics, Tableau. Embedding analytics is a way we can help our customers make smarter decisions and achieve greater success. When creating an embedded analytics offering, the biggest decision is whether to build an in-house solution or purchase a turnkey solution. Clayron “Cj” Pace.
This month’s theme was measurement – here’s a summary of the month’s learnings: Measurement Approaches. What useful nugget did you learn from analyzing your social media metrics data or your measurement process that lead to a success or improvement in your social media practice? Data Analysis.
That’s why it’s never been more essential for companies to create a comprehensive analytics strategy and become data-driven. Tableau Pulse In the past, proficiency in data and analytics required specific skill sets. Your personalized Tableau Pulse homepage displays a summary of the key metrics that you follow.
Product Marketing Manager, Embedded Analytics, Tableau. Embedding analytics is a way we can help our customers make smarter decisions and achieve greater success. When creating an embedded analytics offering, the biggest decision is whether to build an in-house solution or purchase a turnkey solution. . Clayron “Cj” Pace.
Summari took a shot at making article summaries on demand a must-have tool for the overloaded reader. The original use case had users feed a URL to the service via browser extension, and Summari would generate a summary, naturally, in just a few seconds. And once you give them a shot, you may find them hard to do without.
The eighth annual Blackbaud Target Analytics donorCentrics Sustainer Summit brought together 36 of the nation’s large national fundraising organizations to share results and discuss sustainer growth and retention strategies against the backdrop of the pandemic and other significant events that impacted donors and giving in 2020 and 2021. .
What you can do: Use Flipcauses analytics tools to create reports that capture year-end giving trends. Look for key metrics like average donation size, frequency, and donor demographics to inform your future outreach strategies. What you can do: Export transaction histories and financial summaries directly from Flipcause.
Traditional metrics like pageviews and session duration are increasingly influenced by bot behavior. This dual-audience analytics approach provides a complete picture of your digital presence and impact. Summarize Clearly for AI Craft concise content summaries that AI can easily extract and present.
The post provides some great recommendations on dashboard design, but also illustrates how to link your objectives, metrics, and KPIs to dashboard design. It’s All About A Few Key Metrics, Not Data Overload. These become the metrics & KPIs behind our work. Daniel Chase. Provide feedback over time. Keep It Simple.
This means Zoom customers, Zoom One Pro Business and Business Plus users will have free access to Read’s premium features, like real-time and advanced meeting metrics, for 12 months. Read’s Meeting Summary tool. They use Read has a virtual assistant to produce summaries of all meetings and follow-up items.
Executive summaries enhance dashboards but require a lot of time and effort. By the time you analyze the data, curate insights, and write the summary, it can already be outdated. Data Stories generate dynamic and customizable plain-language summaries that update as new data comes in and as you interact with your dashboard.
Executive summaries enhance dashboards but require a lot of time and effort. By the time you analyze the data, curate insights, and write the summary, it can already be outdated. Data Stories generate dynamic and customizable plain-language summaries that update as new data comes in and as you interact with your dashboard.
Their categories were based on whether or not the respondent was using a specific measurement tool like Facebook Insights or Google Analytics. Here’s a summary a responses from my Facebook Page. We all need to be curators of our analytics data. The Idealware survey asked participants if they measure results from Facebook.
There have been a lot of questions about customized Facebook landing pages and my business partner at Zoetica, Kami Huyse, wrote this fantastic summary of the resources shared. This post harvests some of the insights shared about social media measurement and nonprofits. There are specific metrics for specific platforms.
Learn more from guest blogger Ikechi Okoronkwo, Executive Director, Business Intelligence & Advanced Analytics at Mindshare. As a global media agency network that delivers value in different ways (media investment management, planning and buying, content, creative, strategy, analytics, etc.), Download Now.
It goes beyond just analytics tools to exploring tools, techniques, and data for measuring deep civic engagement, open governance, and inclusive decision-making. My colleague, Anne Whatley, wrote this summary of what you’ll find when you dig into these two stellar and highly practical reports and resource lists.
The following is a work in progress summary of how keeping teams independent can help scale a company, using my experience at Wooga as an example. Further feature development does not slow down the development process but as extra information is derived from live metrics, a/b testing becomes possible and the whole game needs to be operated.
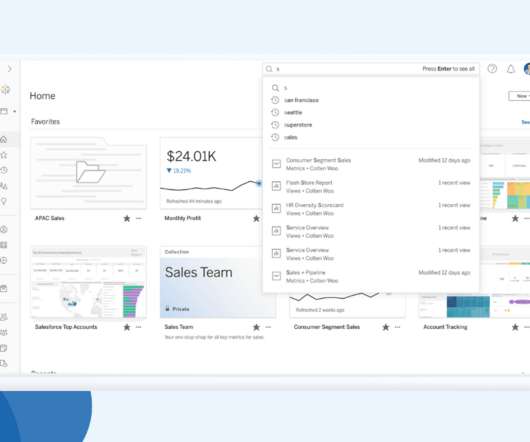
If you've ever written an executive summary of a dashboard, you know it’s time consuming to distill the “so what” of the data. With Data Stories , you can automate customizable dashboard summaries instead. . The amount of content in your analytics environment can be overwhelming. And now, Metrics are configurable. .
If you've ever written an executive summary of a dashboard, you know it’s time consuming to distill the “so what” of the data. With Data Stories , you can automate customizable dashboard summaries instead. . The amount of content in your analytics environment can be overwhelming. And now, Metrics are configurable. .
I’m here at NTEN’s 09NTC and am going to live blog Beth Kanter’s session on mapping your social media strategy to metrics. The right metrics. Analytics tools. Themes that people want to learn: new metrics structures can bubble up. funders of a 20th century mindset - what metrics speak to them.
Rather than download a spreadsheet of the most important data points for a month from Facebook Insights (the Facebook page analytics tool which was recently upgraded ) and comparing it against content, engagement, and outreach strategies, administrators glance at the summary insights on their page and draw subjective conclusions.
A spreadsheet with those metrics laid out on a weekly basis will help you identify large upticks in costs, which can then guide your future budget allocations. Regression analysis If you’re looking to get analytical and have a minimum of 90 days of data at varying levels of spending, a regression analysis is your answer.
“We removed some in-the-weeds data about growth loop conversion metrics,” the team told me, “along with sales cycle/revenue traction.” When I recently talked to the DocSend team about what the most important slides are in a deck, they shared that the summary slide is starting to be more and more important.
Here’s a link to a summary and the recording over at the Care 2 Frogloop blog. Twitalyzer is a terrific analytics tool that gives you some good benchmarking metrics for Twitter. Yesterday, Allison Fine and I, along with colleagues Danielle Bridiga and Marc Sirkin gave a Care 2 Webinar on the Networked Nonprofit.
Before stints as an investor, CEO Kat Orekhova was head of product at Ironclad and held a variety of roles at Facebook, including head of forecasting and analytics. For example, we spoke to a hardware company whose team takes four weeks to put together the business summary for the prior month,” Orekhova explained. “So
underperforming on images of people with certain skin tones) can we measure and how can we use these metrics to design better algorithms? Overall quality has historically been defined and measured using summary statistics (like overall accuracy) over a test dataset as a proxy for user experience. What kinds of system biases (e.g.,
Tableau Ambassadors are leaders in our community and data champions who want to bring analytics to everyone. CRM Analytics Ambassadors are power users of the native analytics and AI solution for Salesforce. Then here’s the link to get started. Otherwise, read on. What do Tableau Ambassadors do?
This has an added benefit of increasing your “people talking about” metric which gets the content into more newsfeeds. Here’s a brief summary of the tip with a link to the full post with more tips. The PTAT metric includes all the following activities that happen on your page over a one-week rolling period: Liking a page.
Managers can see real-time summary data including usage statistics and a breakdown of performance relative to core concepts for groups of learners. Then, at an organizational level, machine learning can be used to spot trends and patterns which can benefit the majority.
In the following examples, we’ll be using Looker, but most modern BI tools enable usage-based reporting in some form (Lightdash also has built in Usage Analytics , Tableau Cloud offers Admin Insights , and Mode’s Discovery Database offers access to usage data, just to name a few). Source: synq.io Source: synq.io Source: secoda.co
This collection point may serve as a system of record, a source for analytics strategy, a repository of otherwise irreconcilable data structures, as a historical archive, or innumerable other business functions. Higher Education Data Warehousing Use Cases. This line of thinking also applies to direct mail campaigns and large email blasts.
But Pilot AI founder Max Lu, previously a software engineer at Salesforce, says his product is more thorough than most, and can generate a summary of each call as well as data points that map to CRM fields and questions asked by reps, in addition to key parts of the recipient’s answer. and Microsoft’s Viva Sales also do this.
Complete spending analytic in one place” — summary slide. In a TC+ post, she shares three strategies for digitizing this process, along with suggestions for sub-metrics to track that will give you an accurate snapshot of your financial health. Competition slide. Revenue model slide. Market opportunity slide.
Your organization probably generates and collects a lot of data, and AI-powered data analytics tools can help you gain insights into donor behavior, program outcomes, and other key metrics. Functionality : Some key features include customizable templates, integrations, analytics and reporting, and multilingual support.
v3.0 — Metrics, dashboards, insights: fitness as a personalised experience With the streaming and saving pipelines working tirelessly to ingest data into the system, our database now houses a wealth of user and workout records. Now, you might be offended by Mr. Magic Black Box mansplaining what appears to be common sense to you.
Comparing Open Source Content Management Systems This is an excerpt from the 60-page independent Idealware report that provides a summary of what open source content management systems are, what features are often useful to nonprofits, and a detailed comparison of WordPress, Joomla, Drupal, and Plone. Week 5: Metrics and Analytics.
I don’t know for sure, but I can show you how to answer that question for yourself using the good ol’ scientific method and Google Analytics. Define your key metrics – Do you want to increase form conversion rates, or increase average gift size, increase the number of people signing up for sustaining gifts, or some other factor?
A short summary, access to more videos, or links will help encourage viewers to explore further. It is YouTube's primary measure of video quality and is the key metric used by YouTube's search and discovery systems. Rosser suggested reviewing your YouTube analytics to understand the length that appeals to your audience.
Your organization’s logo is the visual summary of your organization’s brand. Review the analytics from your nonprofit’s website. However, if these engagement metrics are chronically low, your nonprofit may need more than routine maintenance—you may need an overhaul. Your site doesn’t engage your audience.
Program managers pick their favorite metrics and apply them to their weekly updates and for the most part, we in the industry are missing out on the incredible potential in this field of metrics. In summary, the immediate future of the Learning Management Systems industry is full of innovation.
We organize all of the trending information in your field so you don't have to. Join 12,000+ users and stay up to date on the latest articles your peers are reading.
You know about us, now we want to get to know you!
Let's personalize your content
Let's get even more personalized
We recognize your account from another site in our network, please click 'Send Email' below to continue with verifying your account and setting a password.


Let's personalize your content