This site uses cookies to improve your experience. To help us insure we adhere to various privacy regulations, please select your country/region of residence. If you do not select a country, we will assume you are from the United States. Select your Cookie Settings or view our Privacy Policy and Terms of Use.
Cookie Settings
Cookies and similar technologies are used on this website for proper function of the website, for tracking performance analytics and for marketing purposes. We and some of our third-party providers may use cookie data for various purposes. Please review the cookie settings below and choose your preference.
Used for the proper function of the website
Used for monitoring website traffic and interactions
Cookie Settings
Cookies and similar technologies are used on this website for proper function of the website, for tracking performance analytics and for marketing purposes. We and some of our third-party providers may use cookie data for various purposes. Please review the cookie settings below and choose your preference.
Strictly Necessary: Used for the proper function of the website
Performance/Analytics: Used for monitoring website traffic and interactions
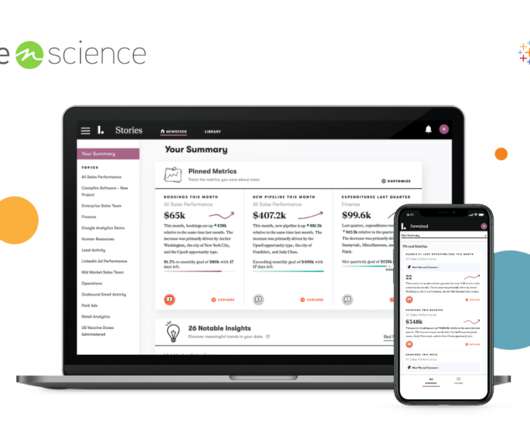
Today I’m pleased to share that our mission to help people see and understand data becomes even stronger with our acquisition of Narrative Science, a Tableau partner since 2016 and global leader in data storytelling technologies. . This creates even more exciting opportunities in augmented analytics as the next frontier.
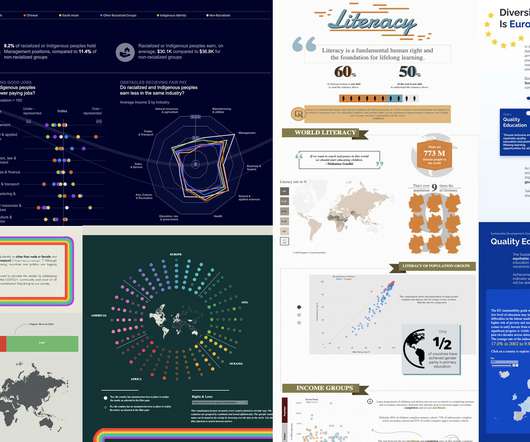
CJ Mayes produced a visually stunning piece on the misconceptions around African literacy rates and global health. Kimly Scott moved everyone with her storytelling, using her own life to shine the spotlight on educational differences between her birth country of Cambodia and her home country of Australia. Let’s build a trellis chart!
Today I’m pleased to share that our mission to help people see and understand data becomes even stronger with our acquisition of Narrative Science, a Tableau partner since 2016 and global leader in data storytelling technologies. . This creates even more exciting opportunities in augmented analytics as the next frontier.
In collaboration with Tableau, Pathstream developed a 5-month fully-online Data & Business Analytics Certificate that builds critical skills to connect college and career for non-traditional students. Tableau has been the ideal partner in creating the Data Analytics program,” says Pathstream CEO Eleanor Cooper.
CJ Mayes produced a visually stunning piece on the misconceptions around African literacy rates and global health. Kimly Scott moved everyone with her storytelling, using her own life to shine the spotlight on educational differences between her birth country of Cambodia and her home country of Australia. Let’s build a trellis chart!
Highlights of this Update: Global Literacy Human Rights Benetech Labs Communications Global Literacy Bookshare celebrated a double milestone this summer, reaching over 200,000 available titles in our collection and serving over 250,000 members with disabilities!
A beautiful combination of research, theory, and practice, it provides a resource to understand the perception, cognition, and consumption of visual analytics. For those who are new to data visualization, Steve Wexler’s The Big Picture focuses on how those in leadership roles can utilize visual analytics. Andy Kriebel , VizWiz.
A beautiful combination of research, theory, and practice, it provides a resource to understand the perception, cognition, and consumption of visual analytics. For those who are new to data visualization, Steve Wexler’s The Big Picture focuses on how those in leadership roles can utilize visual analytics. Andy Kriebel , VizWiz.
Women in Dataviz Global #DataTribe - Ask me Anything CRM Analytics Vizzes Dennis Kao: Pizza: Manhattan See the latest Viz of the Day , trending vizzes, featured authors, and more on Tableau Public. Community Calendar and Upcoming Events : stay up-to-date on the latest Women in Dataviz events and other data visualization-related events.
Women in Dataviz Global #DataTribe - Ask me Anything CRM Analytics Vizzes Dennis Kao: Pizza: Manhattan See the latest Viz of the Day , trending vizzes, featured authors, and more on Tableau Public. Community Calendar and Upcoming Events : stay up-to-date on the latest Women in Dataviz events and other data visualization-related events.
Vizzes advance as the industry learns more about accessibility and human cognition, and as improved data literacy pushes the world to be more data driven. For example, analytics was front and center during the Winter Olympic Games. Broadcasters discussed and displayed analytics in sports like figure skating, speed skating, and bobsled.
Whether you specialize in healthcare , financial literacy, environmental advocacy, or animal welfare, consider how you can leverage your unique experience and expertise to create quality web content. This makes content generation a low-cost, high-impact way to increase marketing-qualified leads for your nonprofit.
Vizzes advance as the industry learns more about accessibility and human cognition, and as improved data literacy pushes the world to be more data driven. For example, analytics was front and center during the Winter Olympic Games. Broadcasters discussed and displayed analytics in sports like figure skating, speed skating, and bobsled.
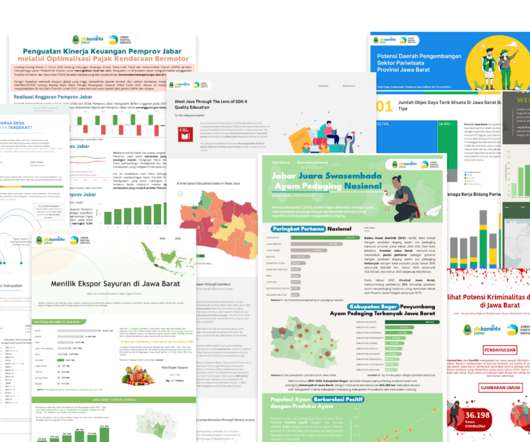
Using the theme of "Think Globally, Act Locally", the aim of the competition was to demonstrate the power of data visualization and storytelling. Arrange Workshops A Viz Games is designed to upskill everyone so its participants are all armed with the same foundational knowledge on data and Tableau or your analytics tool of choice.
Using the theme of "Think Globally, Act Locally", the aim of the competition was to demonstrate the power of data visualization and storytelling. Arrange Workshops A Viz Games is designed to upskill everyone so its participants are all armed with the same foundational knowledge on data and Tableau or your analytics tool of choice.
In collaboration with Tableau, Pathstream developed a 5-month fully-online Data & Business Analytics Certificate that builds critical skills to connect college and career for non-traditional students. Tableau has been the ideal partner in creating the Data Analytics program,” says Pathstream CEO Eleanor Cooper.
I looked at it and said, ‘It’s good that they’re doing this, but it could be a lot better,’” said Feinberg, whose area of expertise is data literacy. His company is a certified Tableau Software Silver Services Partner, and he is well versed in visual analytics best practices and capabilities of products within the Tableau platform.
I looked at it and said, ‘It’s good that they’re doing this, but it could be a lot better,’” said Feinberg, whose area of expertise is data literacy. His company is a certified Tableau Software Silver Services Partner, and he is well versed in visual analytics best practices and capabilities of products within the Tableau platform.
data literacy, device preferences)? Interviews, usability testing, card sorting, and reviewing analytics can give you a better understanding of your audience’s needs and behaviors. articles, interactive media, storytelling elements) do you have? Audiences: Which audience groups are you prioritizing?
Vancouver, British Columbia: Hands on with Google Analytics. Morrisville, North Carolina: Nonprofit Storytelling: What You Need to Know. Nairobi, Kenya: NetSquared Kenya Women and Web Literacy Program 2016 – 17. Tuesday, November 15, 2016. Las Vegas, Nevada: QuickBooks Made Easy. Berkeley, CA: Apps4Change Demo Breakfast.
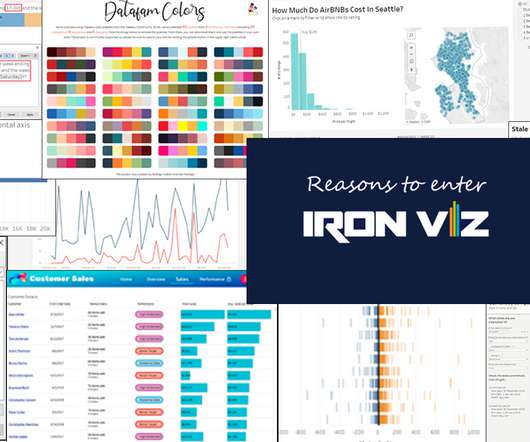
By entering, you’re developing your data literacy and data storytelling skills. You’re building a bigger Tableau portfolio, too, which is great for a career in data analytics. Formatting, Design, Storytelling. Win or learn, you can’t lose. The Tableau Community is a great resource for Iron Viz inspiration. Inspiration.
By entering, you’re developing your data literacy and data storytelling skills. You’re building a bigger Tableau portfolio, too, which is great for a career in data analytics. Formatting, Design, Storytelling. Win or learn, you can’t lose. The Tableau Community is a great resource for Iron Viz inspiration. Inspiration.
The demand for skilled data analytics professionals continues to grow, and it is a C-suite priority. However, people often lack essential data skills with only 33% of employees comfortable using data analytics to support their decisions. Objective: Upskill in data visualization and storytelling in Tableau. September 8, 2022.
The demand for skilled data analytics professionals continues to grow, and it is a C-suite priority. However, people often lack essential data skills with only 33% of employees comfortable using data analytics to support their decisions. Objective: Upskill in data visualization and storytelling in Tableau. September 8, 2022.
The demand for skilled data analytics professionals continues to grow, and it is a C-suite priority. However, people often lack essential data skills with only 33% of employees comfortable using data analytics to support their decisions. Objective: Upskill in data visualization and storytelling in Tableau. September 8, 2022.
However, data-backed storytelling takes more thought than picking a few impact metrics, posting them online, and calling it a day. Collect the Right Data for Storytelling The core of impactful storytelling is defining the narrative you want to share. Lets get started!
We organize all of the trending information in your field so you don't have to. Join 12,000+ users and stay up to date on the latest articles your peers are reading.
You know about us, now we want to get to know you!
Let's personalize your content
Let's get even more personalized
We recognize your account from another site in our network, please click 'Send Email' below to continue with verifying your account and setting a password.


Let's personalize your content