This site uses cookies to improve your experience. To help us insure we adhere to various privacy regulations, please select your country/region of residence. If you do not select a country, we will assume you are from the United States. Select your Cookie Settings or view our Privacy Policy and Terms of Use.
Cookie Settings
Cookies and similar technologies are used on this website for proper function of the website, for tracking performance analytics and for marketing purposes. We and some of our third-party providers may use cookie data for various purposes. Please review the cookie settings below and choose your preference.
Used for the proper function of the website
Used for monitoring website traffic and interactions
Cookie Settings
Cookies and similar technologies are used on this website for proper function of the website, for tracking performance analytics and for marketing purposes. We and some of our third-party providers may use cookie data for various purposes. Please review the cookie settings below and choose your preference.
Strictly Necessary: Used for the proper function of the website
Performance/Analytics: Used for monitoring website traffic and interactions
Adopt a Disruption-Ready Mindset: Use data analytics to identify trends and anticipate changes before they happen. By focusing on member-centric goals and leveraging data analytics, they were able to anticipate industry shifts and tailor their offerings accordingly. Regular training sessions ensure theyre prepared for whats next.
Limited Use of Data and Analytics In an increasingly data-driven world, the ability to gather, analyze, and act on data is a key differentiator. Data analytics can help you anticipate changes and adapt proactively. How.orgSource Can Help: We empower associations with data analytics tools and dashboards that provide actionable insights.
Our survey shows that while many organizations value collaboration, theres often a need for digital literacy and alignment across teams. Implement Data Analytics : Leverage data analytics to track member behavior, event participation, and other key metrics. This technology enhances member experiences and increases engagement.
For business leaders, this meant an organizational shift toward more data-driven jobs and a heightened focus on data skills—a transition that revealed the widespread lack of data skills and data literacy. Once meant for data scientists and analysts, data literacy is now a requirement for all—from business leaders to front-line workers.
For business leaders, this meant an organizational shift toward more data-driven jobs and a heightened focus on data skills—a transition that revealed the widespread lack of data skills and data literacy. Once meant for data scientists and analysts, data literacy is now a requirement for all—from business leaders to front-line workers.
Identify Skill Gaps: Determine where training is needed, particularly in digital literacy and data analysis, to equip your team for success. Use Real-Time Data: Leverage analytics to monitor progress and make data-driven decisions. Refine Regularly: Schedule periodic reviews to assess progress and adjust initiatives as needed.
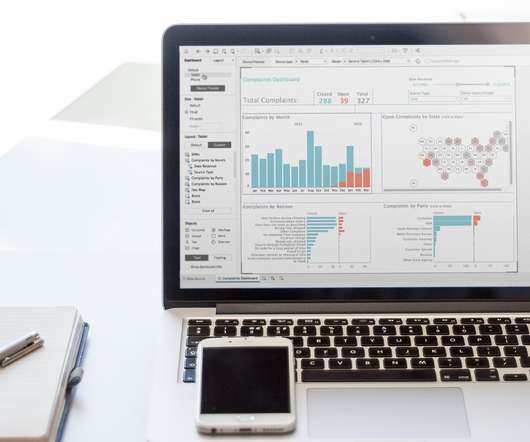
You probably have a long list of great things you want to accomplish this year…including making analytics a priority. We can help you move analytics to the top of the list by giving you tips to build a business case and how to articulate it to others. Let’s build your business case to make data analytics a top priority: 1.
At Tableau, we believe that everyone needs some level of data literacy, and the best place to start is with the basics. First, let’s talk about what data literacy means. Data Literacy is the range of capabilities that describe someone’s ability to explore, understand, and communicate with data. August 15, 2024
Especially in associations, analytics can provide invaluable insights, guiding strategies and shaping outcomes. However, the hurdle remains: how do you convince the powers-that-be to earmark a slice of the budget for analytics? By using analytics, they realize that most of their online course engagement happens in the evenings.
Bridge the data literacy gap for students in academia. Working with data is a necessity for most jobs, and analytical skills can be a huge differentiator for success across all kinds of work—whether corporate, nonprofit, or academic. We define data literacy as “the ability to explore, understand, and communicate with data.”
Organizations can also instill a data culture by promoting data literacy—because in order for employees to participate in a data culture, they first need to speak the language of data. Here’s how organizations can improve their data literacy with a four-step action plan: 1. Data literacy involves more than having a set of skills.
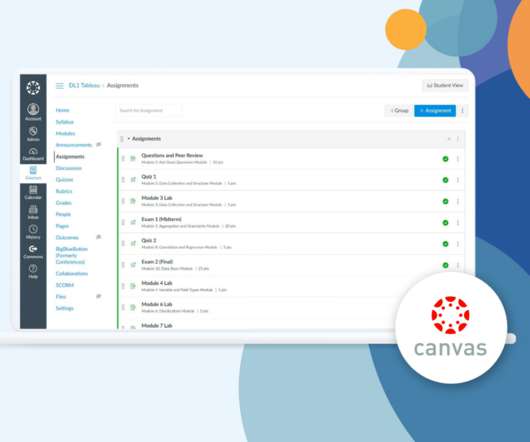
I’m proud to announce that our ready-made Data Literacy One curriculum is now available in Canvas learning management system (LMS) format. This latest Tableau Academic program release enables instructors to quickly get up and running to teach data literacy skills to the next generation of decision makers. . September 2, 2021 - 1:50pm.
Employees need to possess data literacy and skills to discover insights, trends, and patterns relevant to solving business problems. But data literacy as a shift in mindset can’t be an afterthought, and must be prioritized by leaders to instill the necessary skills into an organization’s culture.
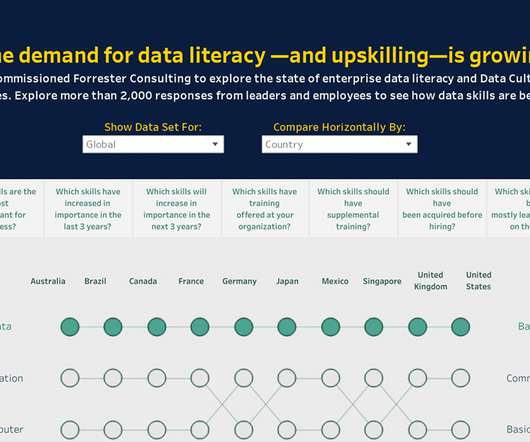
According to a recently released Forrester Consulting study commissioned by Tableau about data literacy and culture in global enterprises, organizations that have a companywide mandate to their data literacy training have higher employee satisfaction levels with training offerings than those that focus at the team or department level.
You can also take our data analytics maturity assessment to see where you stand today in your analytics journey and steps you can take to move to the next level. The post A Lightweight Framework for Building An Association Data Strategy appeared first on Association Analytics. Don’t strive for perfection.
I’m proud to announce that our ready-made Data Literacy One curriculum is now available in Canvas learning management system (LMS) format. This latest Tableau Academic program release enables instructors to quickly get up and running to teach data literacy skills to the next generation of decision makers. September 2, 2021 - 1:50pm.
According to a recently released Forrester Consulting study commissioned by Tableau about data literacy and culture in global enterprises, organizations that have a companywide mandate to their data literacy training have higher employee satisfaction levels with training offerings than those that focus at the team or department level.
Employees need to possess data literacy and skills to discover insights, trends, and patterns relevant to solving business problems. But data literacy as a shift in mindset can’t be an afterthought, and must be prioritized by leaders to instill the necessary skills into an organization’s culture.
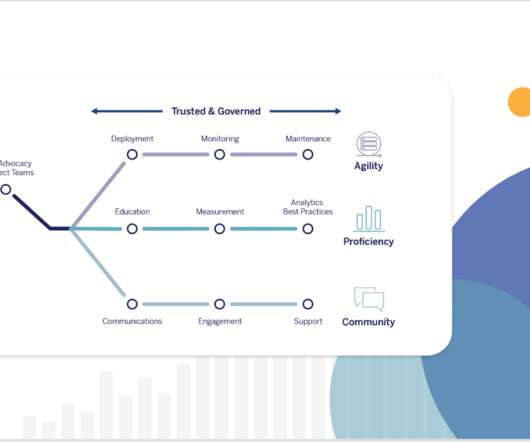
This is the final post in a three-part series about transformational analytics for the enterprise. In case you missed them, read the first on governance and data management that enables your digital business , and the second on modern analytics for fast decision-making. Adopt an agile approach to managing your analytics environment.
Many organizations are challenged with scaling analytics to reach every employee and/or realizing the full value of their analytics investments. Organizations are investing trillions to become more data-driven, but only 8% successfully scale analytics to get value from their data, according to McKinsey. .
This is the final post in a three-part series about transformational analytics for the enterprise. In case you missed them, read the first on governance and data management that enables your digital business , and the second on modern analytics for fast decision-making. Support employees in growing their analytics skills.
Our mission is to lower the barrier of entry to learning analytics and build data literacy skills in future generations. . They shared the misconception that analytics only fit with the technical faculties. Tableau Academic Programs works towards data literacy for all, such as our data literacy curriculum for higher education.
This is the final post in a three-part series about data and analytics governance. Does most of your workforce rely on analytics to do their jobs, or is being a data-driven organization still a far-off dream? Crafting and executing your plan to amplify data and analytics. . Where can IT focus on data and analytics enablement?
This is the final post in a three-part series about data and analytics governance. Does most of your workforce rely on analytics to do their jobs, or is being a data-driven organization still a far-off dream? Crafting and executing your plan to amplify data and analytics. . Where can IT focus on data and analytics enablement?
This includes offering broader access to data and analytics and embracing the cloud to better adapt, innovate, and grow more resilient while facing the unexpected. Let’s take a closer look at what’s top of mind for IT to best enable the business while scaling your analytics program. . Supporting your data infrastructure.
The post How to Maintain Relevance and Revenue in Today’s Economy appeared first on Association Analytics. If you’re ready to learn more about how to leverage your data to stay relevant and maintain revenue, you can watch our on-demand webinar or schedule a call with one of our data experts.
Let's explore how data analytics can be strategically applied to crucial components of your fundraising event, helping guide you towards making more informed decisions and impactful outcomes. Email Outreach Before your event begins, building excitement and driving participation is crucial to your success.
This week, Gartner published the 2021 Magic Quadrant for Analytics and Business Intelligence Platforms. In every release, we're making Tableau easier to use, more powerful, and simpler to deploy to support governed data and analytics at scale. Accelerate adoption with intuitive analytics that people love to use.
Analytics for everyone: Explore new and existing innovations and smart analytical experiences, like predictive analytics, Tableau Business Science , and Tableau for the Enterprise , that make it easier for everyone in an organization to use data and analytics. . Theme: Analytics for everyone.
Our mission is to lower the barrier of entry to learning analytics and build data literacy skills in future generations. They shared the misconception that analytics only fit with the technical faculties. Tableau Academic Programs works towards data literacy for all, such as our data literacy curriculum for higher education.
Bridge the data literacy gap for students in academia. Working with data is a necessity for most jobs, and analytical skills can be a huge differentiator for success across all kinds of work—whether corporate, nonprofit, or academic. We define data literacy as “the ability to explore, understand, and communicate with data.”
Organizations can also instill a data culture by promoting data literacy—because in order for employees to participate in a data culture, they first need to speak the language of data. Here’s how organizations can improve their data literacy with a four-step action plan: 1. Data literacy involves more than having a set of skills.
Many organizations are challenged with scaling analytics to reach every employee and/or realizing the full value of their analytics investments. Organizations are investing trillions to become more data-driven, but only 8% successfully scale analytics to get value from their data, according to McKinsey. .
In fact, Tableau recently commissioned Forrester to investigate the data literacy gap, and according to The Great Data Literacy Gap: Demand for Data Skills Exceeds Supply , only 66% of surveyed academic decision-makers rated data literacy and skills as important for students to learn to graduate, compared to 81% of recruiters.
A newly released executive survey revealed that 99% of major American companies invested last year in data and analytics, and 91.9% Investments in data governance, data literacy, programs that build awareness of the value and impact of data within an organization, represent an important step in the right direction.
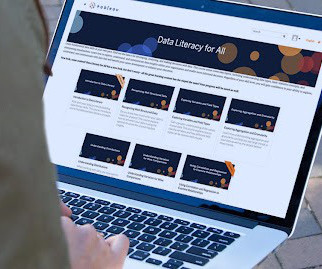
Although most people are familiar with the current trend of growing amounts of data, there is a skills gap in data literacy - defined as the ability to explore, understand, and communicate with data. We are thrilled to expand our work with data skills education with Data Literacy eLearning.
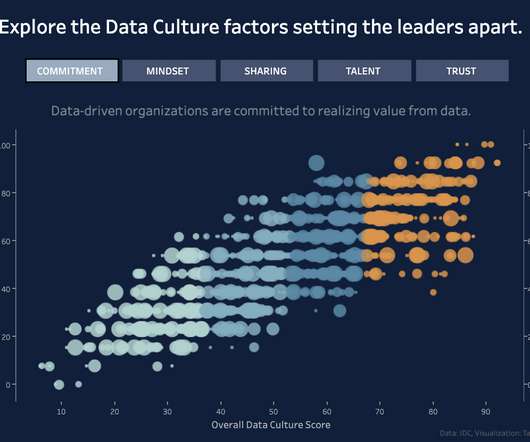
This trend relates to the ability of individuals to analyze, interpret, and communicate with data, and then use it to argue a point or make smarter decisions—a set of competencies also known as data literacy. From that flowed the analytics skills everyone felt comfortable using. Trend #2: Trust. On average, 73.5% Trend #4: Sharing.
Analytics for everyone: Explore new and existing innovations and smart analytical experiences, like predictive analytics, Tableau Business Science , and Tableau for the Enterprise , that make it easier for everyone in an organization to use data and analytics. . Theme: Analytics for everyone.
Although digital competencies like computer literacy and data skills have grown in importance in recent years, the need for digital skills has never been greater. Educators must develop programs to address the digital skills gap and teach digital literacy. Forrester conducted two online surveys to explore this topic.
According to Community Brands 2022 Association Trends Study, while data analytics is a higher priority for organizations, just one-third of association professionals report their data is excellent or very good. Does your staff require any additional training to better manage member analytics? . What is the state of your member data?
According to a recently released Forrester Consulting study commissioned by Tableau about data literacy and culture in global enterprises, organizations that have a companywide mandate to their data literacy training have higher employee satisfaction levels with training offerings than those that focus at the team or department level.
In fact, Tableau recently commissioned Forrester to investigate the data literacy gap, and according to The Great Data Literacy Gap: Demand for Data Skills Exceeds Supply , only 66% of surveyed academic decision-makers rated data literacy and skills as important for students to learn to graduate, compared to 81% of recruiters.
In collaboration with Tableau, Pathstream developed a 5-month fully-online Data & Business Analytics Certificate that builds critical skills to connect college and career for non-traditional students. Tableau has been the ideal partner in creating the Data Analytics program,” says Pathstream CEO Eleanor Cooper.
And as we’ve spent time, in fact years, supporting practitioners in skilling up and differentiating themselves, we’ve seen what benefits Tableau Certification can deliver for analytics talent. Grow the must-have, base-level skill: Data literacy. Here are five ways that it can create immediate and long-term impact for you.
We organize all of the trending information in your field so you don't have to. Join 12,000+ users and stay up to date on the latest articles your peers are reading.
You know about us, now we want to get to know you!
Let's personalize your content
Let's get even more personalized
We recognize your account from another site in our network, please click 'Send Email' below to continue with verifying your account and setting a password.


Let's personalize your content