This site uses cookies to improve your experience. To help us insure we adhere to various privacy regulations, please select your country/region of residence. If you do not select a country, we will assume you are from the United States. Select your Cookie Settings or view our Privacy Policy and Terms of Use.
Cookie Settings
Cookies and similar technologies are used on this website for proper function of the website, for tracking performance analytics and for marketing purposes. We and some of our third-party providers may use cookie data for various purposes. Please review the cookie settings below and choose your preference.
Used for the proper function of the website
Used for monitoring website traffic and interactions
Cookie Settings
Cookies and similar technologies are used on this website for proper function of the website, for tracking performance analytics and for marketing purposes. We and some of our third-party providers may use cookie data for various purposes. Please review the cookie settings below and choose your preference.
Strictly Necessary: Used for the proper function of the website
Performance/Analytics: Used for monitoring website traffic and interactions
In this blog, we share tips on how to take your marketing to the next level with the help of analytics. By having tags in place, you can start building personas around your member’s behaviors and demographics and begin to learn what types of products and services they are interacting with and when. Easy Access to All Data.
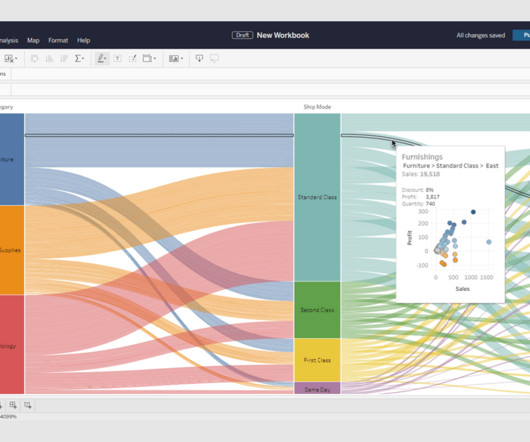
More expressive web visualizations can be integrated to how and where you work with data, and Viz Extensions interact with—and feel just like—the rest of Tableau. For developers, Viz Extensions create an opportunity to bring custom visualizations into Tableau’s analytics capabilities. How can Tableau customers test Viz Extensions now?
First thing’s first: I am thrilled to announce that Tableau’s analytics extensions are now available in Tableau Online! analytics extensions have allowed Tableau users to dynamically bring sophisticated analysis and integrations into their visualizations. Get started with analytics extensions in Tableau Online. Kristin Adderson.
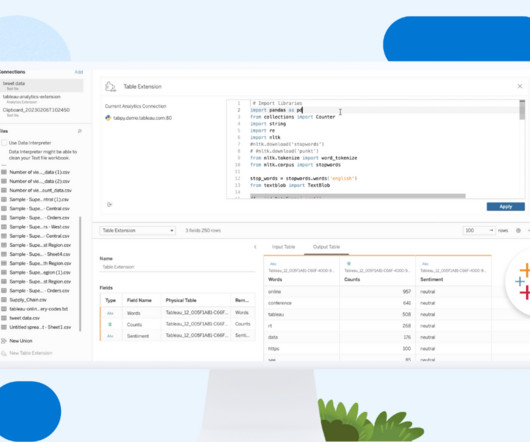
Swetha Bezawada Senior Data Scientist Colten Woo September 26, 2023 - 6:57pm October 2, 2023 The typical analytical ecosystem has two silos: business intelligence and data science. Analytics Extensions do just that! At the root, an Analytics Extension is a server that you stand up to receive data from Tableau in real-time.
Include them in table tents, banners, and event badges to provide instant access to live event schedules, donation portals, or interactive activities. ” Test Thoroughly: Test QR codes across devices and lighting conditions to ensure functionality.
But how do we put the human touch into interactions in a virtual landscape that doesn’t provide emotional cues? Improve communication and collaboration through more productive interactions. Service is a single point on a continuum of interactions that centers around communication and problem-solving.
Swetha Bezawada Senior Data Scientist Colten Woo September 26, 2023 - 6:57pm October 2, 2023 The typical analytical ecosystem has two silos: business intelligence and data science. Analytics Extensions do just that! At the root, an Analytics Extension is a server that you stand up to receive data from Tableau in real-time.
Waldo has raised $15 million for its ‘no code’ automated testing tool. Mobile development teams using Waldo can set up tests without writing a line of scripting code. The best way to understand Waldo is by talking about mobile testing first. Small development teams usually rely a lot on real-life testing.
Dig Deeper and See Farther You may wonder how AI-driven analytics differ from the queries, dashboards, and statistical packages that have been around for some time now. Traditional analytics is like using a microscope to explore a limited area of information; whereas adding AI provides a satellite image of an entire data landscape.
Keeping this in mind that 51% of all emails were opened on mobile devices in 2013 while designing your newsletter template will increase interaction rates, open rates and click through rates. Your subject line should be brief, to the point, and entice an immediate interaction. Test the email on different browsers and devices.
Want to get some ideas for testing your organization''s site? Do a user test of the VisionLink website and see how we are utilizing tips from this post to improve our organization''s site! Ask why they click, move, or view certain sections Present tasks for them to preform (ex: how might you find our contact information?)
Interactive voice advertising startup Instreamatic , which can insert interactive voice ads into an audio stream, has raised $6.1 SF-HQ’d Instreamatic lets brands that advertise through streaming music apps and podcasts (for instance) have interactive voice-based dialogues with consumers. Need help sleeping?”
Prior to the Google Grant application there are a few steps that must be completed first: Make sure you have Google Analytics set up on your website. You should set up the conversion in Google Analytics and import it into Google Ads. Once they are set up in Google Analytics you can then use them in Google Ads.
You can set up the posting times by looking at your analytics to see which are the best times to reach your audience. Ideally, it’s good to test tools around scheduling, campaign management, image and video editing to find what works best for your organization. 5) Pick the right tools. 6) Plan your campaigns.
Once the team aggregated the data and they were able to form a hypothesis, test it and confirm a need. In order to track trends year-over-year, IAEE will repeat many of the same questions, adding in three or four additional questions about programs or services the team is testing.
We couldn’t have guessed that the pandemic would give our recommendations a test drive so quickly. Discover how the American Society for Neuroradiology (ASNR) utilizes Attendee Interactive to streamline abstract submission and review, create agendas, build sessions, manage speakers, and more. leadership. But Industry 4.0
Association Analytics also hosts a webinar series, Navigating the Member Journey Using Data, to helpassociations better understand how their data can help transform their association. As you’re planning out potential customer journeys to membership, keep in mind that it should be a process full of give and take interactions.
Fatemi, who co-founded and sold the AI customer relations service Node , promises a platform where creators will be able to broadcast, record, and monetize conversations while using Fireside’s built-in analytics tools to figure out what content performs best. Twitter is also testing Spaces , its own take on live broadcasted conversations.
Other areas where AI can make an impact are: Meetings and Events—Use predictive analytics to identify which venues will generate the highest number of registrations. Education—Tailor personalized learning journeys, create course outlines, and aid in the development of test questions and learning materials for certification programs.
For instance, if audience engagement is a priority, prompts related to chatbot interactions and personalized messaging are key. Implement and Test : Develop and implement your ChatGPT-powered initiatives. Be sure to continuously test and iterate to ensure optimal performance and user satisfaction.
Amdocs, a leading global provider of software and services to communications and media companies, is harnessing NeMo Guardrails to enhance AI-driven customer interactions by delivering safer, more accurate and contextually appropriate responses.
Using engagement scores to track member interactions can help you identify and address the needs of at-risk members. It’s important to continually test different approaches throughout the year to find what resonates best with your members. You may find more success using different channels, message timings, and segmentation strategies.
Start with a Modeling Workshop and invite subject matter experts from your organization who interact with your members (e.g. Test things. Eventually, you can include data that is harder to access like social media interactions or vendor-managed data sources. membership, philanthropy, finance, marketing, events). Be flexible.
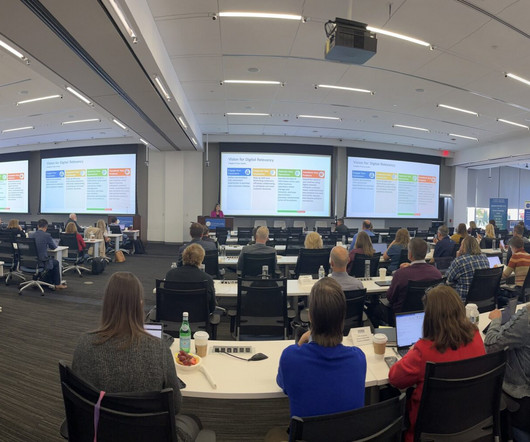
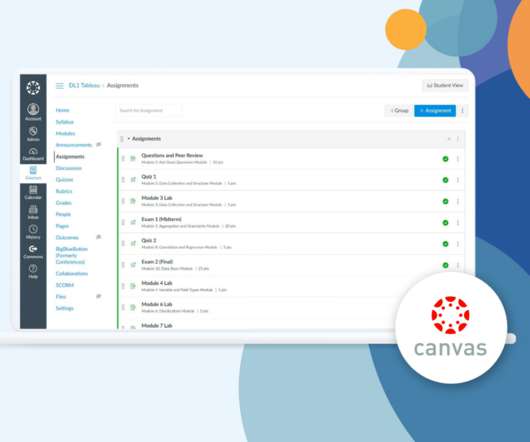
Instructors can spend hours uploading documents, copy-pasting test questions and answers, and organizing modules in their LMS. Interactive guided demos in the Canvas course help students learn Tableau. Includes: 10 instructional modules with lectures, homework assignments, tests and quizzes, discussion boards, and interactive demos.
Working with data is a necessity for most jobs, and analytical skills can be a huge differentiator for success across all kinds of work—whether corporate, nonprofit, or academic. These courses can serve as prerequisites for a variety of analytics, research methods, or data science curricula. Communicating with interactive stories.
Instructors can spend hours uploading documents, copy-pasting test questions and answers, and organizing modules in their LMS. Interactive guided demos in the Canvas course help students learn Tableau. Includes: 10 instructional modules with lectures, homework assignments, tests and quizzes, discussion boards, and interactive demos.
Thankfully, Google Analytics makes it easy. You’ve likely heard that Google has released its new version, Google Analytics 4 (GA4). What Is Google Analytics 4? But what Google Analytics — and GA4 in particular — brings to the table is an extra layer of information. You’ll be pulling in rich data in no time!
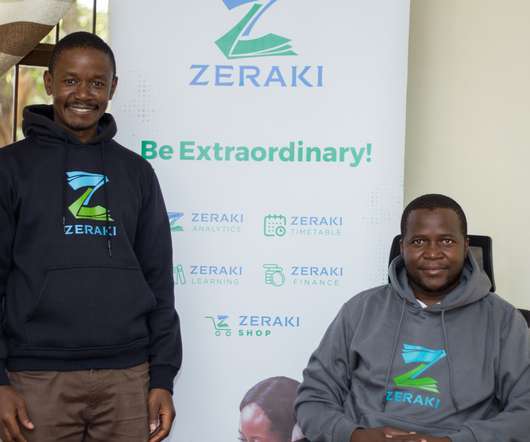
Zeraki , a Kenyan edtech that has built digital learning and school data analytics platforms, has raised $1.8 We have also brought back focus on [the once dormant] digital learning platform, and also tested a number of products like timetabling,” he added. Zeraki data analytics system helps schools to better manage students’ data.
Once you’ve thoroughly analyzed your past campaign analytics, you can create a GivingTuesday strategy that inspires confidence in your team. You can start testing your outreach plans. . Test run Facebook fundraising for other campaigns and create a dossier of fundraising best practices for your volunteer fundraisers.
A suite of tools, apps, and connectors that helps transform disconnected data into clear, engaging, and interactive visuals, Power BI allows you to pull from an open data source—could be from an Excel spreadsheet or a cloud-based CRM system or a federal database—so you can more easily aggregate, visualize, and interpret your data.
Early tests of AR shopping experiences, such as a recent collaboration with Gucci to let people virtually try on a pair of limited-edition sneakers, have shown Snap that people are more likely to buy something after they interact with it in 3D. It also worked with Facebook — Snap’s biggest competitor — on AR shopping tech in 2019.
” , which he used to start the sports analytics company numberFire ( acquired by FanDuel in 2014 ). And today, after a period of beta testing, Bonaddio is launching BigBrain. We do try to keep it interactive.” .” He isn’t kidding about either part of the equation.
Measuring Training Effectiveness: Metrics and Analytics for Educational Institutes, Corporates, and NGOs GyrusAim LMS GyrusAim LMS - Training programs play a pivotal role in the success of any organization. Quantitative data is objective and measurable, such as test scores and performance metrics. What Is Training Effectiveness?
Measuring Training Effectiveness: Metrics and Analytics for Educational Institutes, Corporates, and NGOs GyrusAim LMS GyrusAim LMS - Training programs play a pivotal role in the success of any organization. Quantitative data is objective and measurable, such as test scores and performance metrics. What Is Training Effectiveness?
Measuring Training Effectiveness: Metrics and Analytics for Educational Institutes, Corporates, and NGOs Gyrus Systems Gyrus Systems - Best Online Learning Management Systems Training programs play a pivotal role in the success of any organization. Quantitative data is objective and measurable, such as test scores and performance metrics.
At the end of April, Salesforce developers, integration and analytics experts, and architects converged in San Francisco for two days of workshops and sessions at TrailblazerDX (TDX), Salesforce’s developer conference. Any advanced analytics tool needs access to data from diverse sources. Tableau was another focus of the conference.
leaders imagine the next problem before it surfaces and are willing to test, experiment, and iterate until they find the solution. He developed several programs, which are interactive and fun, to achieve those goals. If I want a coffee at Starbucks, I can order it on my phone and pick it up without interacting with anyone.
Across industries, organizations have been investing heavily to integrate analytics throughout every aspect of their company to capture a portion of the $9.5 trillion value that the McKinsey Global Institute estimates advanced analytics can enable. trillion to $15.4
Dynamic Interactions (Pilot). The Winter ’22 Release is introducing even more interactive pages with Dynamic Interactions. Through these Dynamic Interactions, users can now update multiple components on an app page. When the “Show Cases” button is selected, the List View is updated to show Cases instead of Accounts.
Hosting a dry run of your event will allow each presenter to test the equipment, navigate the virtual platform, configure how the online audience will interact with the platform, and ensure that each session flows seamlessly into the next. . Be prepared for lead generation and analytics.
The underlying analytics were impressive. We regularly test the wording of our call to action to see what works best, whether it’s ‘Save Lives’ or ‘End Cruelty’ or something else,” said Sparenberg. And the only way to know is to test.” Finding the right mix of these elements is often done via a practice known as A/B testing.
Use interactions stored in your database – like registration for an event, response to a petition, or engagement with an email – to identify relevant communications and giving opportunities. Expand your use of email testing to better understand your engaged constituents and determine what interests your audience enough to take an action.
Upgrade to take advantage of these new innovations, and learn more about how Tableau brings AI into analytics to help users across your organization answer pressing questions. Enjoy significant Azure connectivity improvements to better optimize Tableau and Azure together for analytics. Tableau 2021.1 In Tableau 2021.1, Quick LODs.
With more customers using sites and apps to interact with a business, if something is broken or just isn’t working that well, you can lose them much more easily than in the past in physical spaces, when store assistants might help, or the customer might simply get distracted and interested by another product.
We organize all of the trending information in your field so you don't have to. Join 12,000+ users and stay up to date on the latest articles your peers are reading.
You know about us, now we want to get to know you!
Let's personalize your content
Let's get even more personalized
We recognize your account from another site in our network, please click 'Send Email' below to continue with verifying your account and setting a password.


Let's personalize your content