This site uses cookies to improve your experience. To help us insure we adhere to various privacy regulations, please select your country/region of residence. If you do not select a country, we will assume you are from the United States. Select your Cookie Settings or view our Privacy Policy and Terms of Use.
Cookie Settings
Cookies and similar technologies are used on this website for proper function of the website, for tracking performance analytics and for marketing purposes. We and some of our third-party providers may use cookie data for various purposes. Please review the cookie settings below and choose your preference.
Used for the proper function of the website
Used for monitoring website traffic and interactions
Cookie Settings
Cookies and similar technologies are used on this website for proper function of the website, for tracking performance analytics and for marketing purposes. We and some of our third-party providers may use cookie data for various purposes. Please review the cookie settings below and choose your preference.
Strictly Necessary: Used for the proper function of the website
Performance/Analytics: Used for monitoring website traffic and interactions
Heres how to create a strategy that sets you apart: Focus on Member-Centric Goals: Keep your members at the forefront by aligning your strategy with their evolving needs. Adopt a Disruption-Ready Mindset: Use data analytics to identify trends and anticipate changes before they happen.
Define Your Vision and Strategic Goals Your roadmap starts with a clear vision. Steps to Define Your Vision and Goals: Engage Stakeholders: Involve leadership, staff, and members in developing your vision. Steps to Define Your Vision and Goals: Engage Stakeholders: Involve leadership, staff, and members in developing your vision.
Limited Use of Data and Analytics In an increasingly data-driven world, the ability to gather, analyze, and act on data is a key differentiator. Data analytics can help you anticipate changes and adapt proactively. How.orgSource Can Help: We empower associations with data analytics tools and dashboards that provide actionable insights.
Set Clear Goals and Metrics : Define what success looks like in terms of member engagement, satisfaction, and retention. Our survey shows that while many organizations value collaboration, theres often a need for digital literacy and alignment across teams. Track these metrics over time to adjust your strategy as needed.
Strategic Alignment The easiest first step is to review the overarching goals and success factors from your strategic plan. Understand what key performance indicators (KPIs) are involved in determining if your organization is on track to meet your goals. Are the goals measurable or are they “feeling” focused?
You probably have a long list of great things you want to accomplish this year…including making analytics a priority. We can help you move analytics to the top of the list by giving you tips to build a business case and how to articulate it to others. Let’s build your business case to make data analytics a top priority: 1.
Especially in associations, analytics can provide invaluable insights, guiding strategies and shaping outcomes. However, the hurdle remains: how do you convince the powers-that-be to earmark a slice of the budget for analytics? By using analytics, they realize that most of their online course engagement happens in the evenings.
Organizations can also instill a data culture by promoting data literacy—because in order for employees to participate in a data culture, they first need to speak the language of data. Here’s how organizations can improve their data literacy with a four-step action plan: 1. Data literacy involves more than having a set of skills.
Employees need to possess data literacy and skills to discover insights, trends, and patterns relevant to solving business problems. But data literacy as a shift in mindset can’t be an afterthought, and must be prioritized by leaders to instill the necessary skills into an organization’s culture.
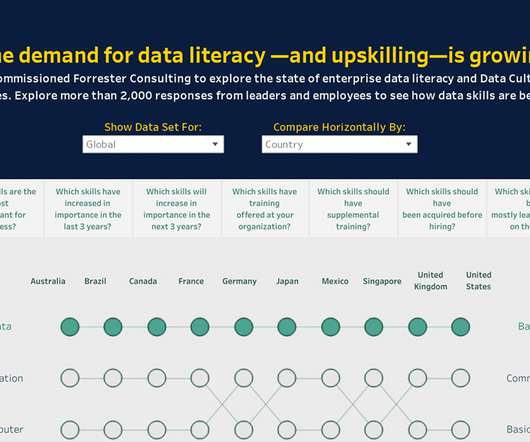
According to a recently released Forrester Consulting study commissioned by Tableau about data literacy and culture in global enterprises, organizations that have a companywide mandate to their data literacy training have higher employee satisfaction levels with training offerings than those that focus at the team or department level.
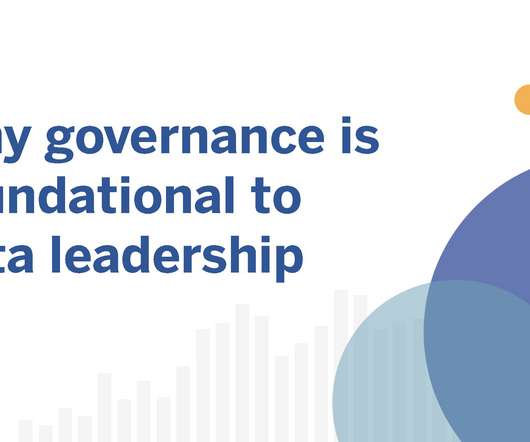
This is the final post in a three-part series about transformational analytics for the enterprise. In case you missed them, read the first on governance and data management that enables your digital business , and the second on modern analytics for fast decision-making. Adopt an agile approach to managing your analytics environment.
Employees need to possess data literacy and skills to discover insights, trends, and patterns relevant to solving business problems. But data literacy as a shift in mindset can’t be an afterthought, and must be prioritized by leaders to instill the necessary skills into an organization’s culture.
According to a recently released Forrester Consulting study commissioned by Tableau about data literacy and culture in global enterprises, organizations that have a companywide mandate to their data literacy training have higher employee satisfaction levels with training offerings than those that focus at the team or department level.
Many organizations are challenged with scaling analytics to reach every employee and/or realizing the full value of their analytics investments. Organizations are investing trillions to become more data-driven, but only 8% successfully scale analytics to get value from their data, according to McKinsey. .
This is the final post in a three-part series about transformational analytics for the enterprise. In case you missed them, read the first on governance and data management that enables your digital business , and the second on modern analytics for fast decision-making. Support employees in growing their analytics skills.
This is the final post in a three-part series about data and analytics governance. Does most of your workforce rely on analytics to do their jobs, or is being a data-driven organization still a far-off dream? Crafting and executing your plan to amplify data and analytics. . Where can IT focus on data and analytics enablement?
The goal is to learn important facts, such as why they joined, why they stay, how they prefer to be communicated with, and whether they prefer in-person or online events. The post How to Maintain Relevance and Revenue in Today’s Economy appeared first on Association Analytics. Unsure about the key components to your value proposition?
This is the final post in a three-part series about data and analytics governance. Does most of your workforce rely on analytics to do their jobs, or is being a data-driven organization still a far-off dream? Crafting and executing your plan to amplify data and analytics. . Where can IT focus on data and analytics enablement?
Let's explore how data analytics can be strategically applied to crucial components of your fundraising event, helping guide you towards making more informed decisions and impactful outcomes. the head of your school or organization will shave their head if you reach your goal).
Periodic technology assessments guarantee that those resources are in good order to deliver on the ambitious goals you’ve set. The objective is to identify strengths and weaknesses and make recommendations for improvements that advance your strategic goals. Be Yourself Every group has unique needs and goals.
According to Community Brands 2022 Association Trends Study, while data analytics is a higher priority for organizations, just one-third of association professionals report their data is excellent or very good. It could be as simple as an organization is yet to set any goals, visions, or KPIs for its data.
This week, Gartner published the 2021 Magic Quadrant for Analytics and Business Intelligence Platforms. In every release, we're making Tableau easier to use, more powerful, and simpler to deploy to support governed data and analytics at scale. Accelerate adoption with intuitive analytics that people love to use.
Many organizations are challenged with scaling analytics to reach every employee and/or realizing the full value of their analytics investments. Organizations are investing trillions to become more data-driven, but only 8% successfully scale analytics to get value from their data, according to McKinsey. .
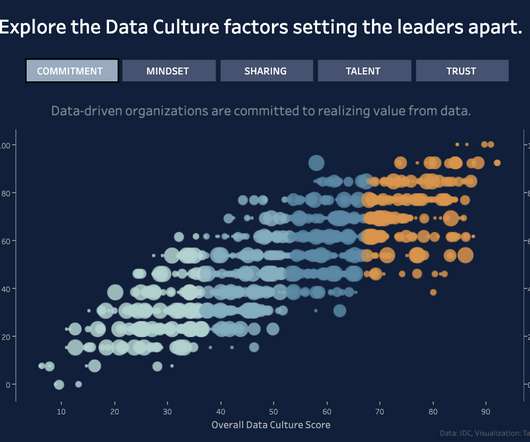
This trend relates to the ability of individuals to analyze, interpret, and communicate with data, and then use it to argue a point or make smarter decisions—a set of competencies also known as data literacy. From that flowed the analytics skills everyone felt comfortable using. Trend #2: Trust. On average, 73.5% Trend #4: Sharing.
Organizations can also instill a data culture by promoting data literacy—because in order for employees to participate in a data culture, they first need to speak the language of data. Here’s how organizations can improve their data literacy with a four-step action plan: 1. Data literacy involves more than having a set of skills.
According to a recently released Forrester Consulting study commissioned by Tableau about data literacy and culture in global enterprises, organizations that have a companywide mandate to their data literacy training have higher employee satisfaction levels with training offerings than those that focus at the team or department level.
Larissa Amoroso Senior Director, Tableau Community, Tableau Ateken Abla July 31, 2023 - 10:22pm August 5, 2023 Analytics is essential for the future of work as more organizations embrace data to make decisions, delight customers, track progress, and innovate their products and offerings. Looking for more?
Highlights of this Update: Global Literacy Human Rights Benetech Labs Communications Global Literacy Bookshare celebrated a double milestone this summer, reaching over 200,000 available titles in our collection and serving over 250,000 members with disabilities! We’re also expanding our efforts to help more people in the U.S.,
If you want extract value from your social media strategy, you need to use measurement. That means setting measurable goals, collecting the right data, making sense of it, and transforming it into actionable decisions. Transdisciplinarity: literacy in and ability to understand concepts across multiple disciplines.
This trend relates to the ability of individuals to analyze, interpret, and communicate with data, and then use it to argue a point or make smarter decisions—a set of competencies also known as data literacy. From that flowed the analytics skills everyone felt comfortable using. Trend #2: Trust. On average, 73.5% Trend #4: Sharing.
Amira Learning is helping young students improve their reading literacy with an AI-powered tutor, while CodeSignal has built a platform for tech workers to pick up new technical skills and practice soft skills through AI-powered simulations. Smalt also boosted average revenue for workers, up 20% compared to 2023.
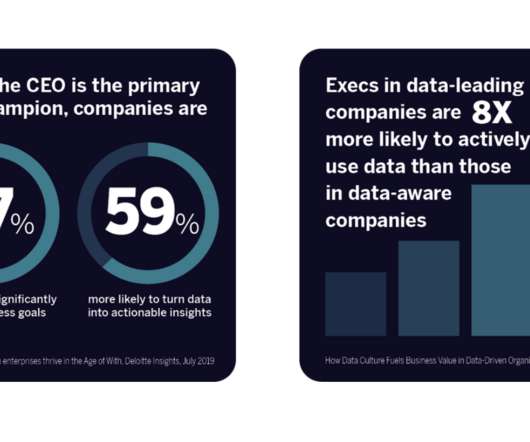
However, we're also seeing organizations successfully deliver self-service analytics at scale with a flexible governance framework that creates trust and confidence in their data and analytics. With the right approach, governance establishes organizational goals and norms for IT oversight of trusted data.
However, we're also seeing organizations successfully deliver self-service analytics at scale with a flexible governance framework that creates trust and confidence in their data and analytics. With the right approach, governance establishes organizational goals and norms for IT oversight of trusted data.
I might tweak this dashboard and also add Google Analytics to keep an eye on your referrals. (1) I might tweak this dashboard and also add Google Analytics to keep an eye on your referrals. (1) I'd set this up with the mission critical feeds to read, plus perhaps a google analytics report, google notes (for a to do list), etc.
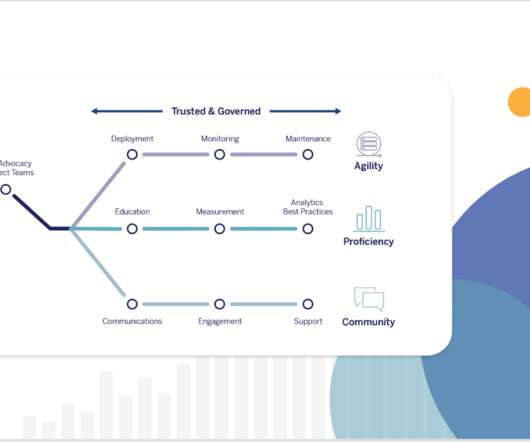
But adopting the right analytics platform isn’t enough: The ultimate accelerator of your data investments is community. Leaders, from line-of-business leads to the C-suite, here’s what you need to know about data communities—and what they mean for the ROI of your analytics technologies and investments. Director, Tableau Community.
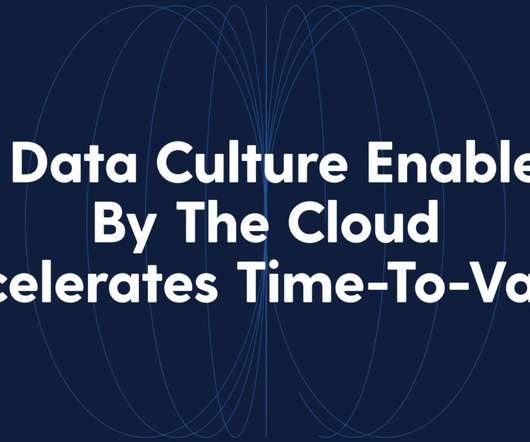
Having data and analytics in the cloud removes barriers to access and trust while strengthening data governance. The goal here is to make data accessible and traceable while deterring unwanted behavior, such as having users share data outside of governed channels because they felt the access was too restrictive. .
Data and analytics used to be tools available to a small number of specially-trained people. This shift in working with data—from a job for the few to a skill for everyone—is actively redefining how the world thinks about analytics. We’re also making it far easier to develop new, powerful analytical apps on the Tableau platform. .
Data and analytics used to be tools available to a small number of specially-trained people. This shift in working with data—from a job for the few to a skill for everyone—is actively redefining how the world thinks about analytics. We’re also making it far easier to develop new, powerful analytical apps on the Tableau platform.
But adopting the right analytics platform isn’t enough: The ultimate accelerator of your data investments is community. Leaders, from line-of-business leads to the C-suite, here’s what you need to know about data communities—and what they mean for the ROI of your analytics technologies and investments. Director, Tableau Community .
Whether you specialize in healthcare , financial literacy, environmental advocacy, or animal welfare, consider how you can leverage your unique experience and expertise to create quality web content. This makes content generation a low-cost, high-impact way to increase marketing-qualified leads for your nonprofit.
This week, Gartner published the 2021 Magic Quadrant for Analytics and Business Intelligence Platforms. In every release, we're making Tableau easier to use, more powerful, and simpler to deploy to support governed data and analytics at scale. Accelerate adoption with intuitive analytics that people love to use.
Consider an AMS that leverages artificial intelligence (AI) and predictive analytics to customize the member experience. With quality reporting, you can stay on track to exceed your goals and increase your ROI. Does your association value technology and data-literacy? An increase in staff retention.
We will discuss how to use this knowledge to power advanced analytics pipelines and operational excellence. In many ways, it is similar to Pandas but the latter has more analytics capabilities under the hood. Each team has their own goals, KPIs, data roles and responsibilities. What is it?
Women in Dataviz Global #DataTribe - Ask me Anything CRM Analytics Vizzes Dennis Kao: Pizza: Manhattan See the latest Viz of the Day , trending vizzes, featured authors, and more on Tableau Public. Community Calendar and Upcoming Events : stay up-to-date on the latest Women in Dataviz events and other data visualization-related events.
We organize all of the trending information in your field so you don't have to. Join 12,000+ users and stay up to date on the latest articles your peers are reading.
You know about us, now we want to get to know you!
Let's personalize your content
Let's get even more personalized
We recognize your account from another site in our network, please click 'Send Email' below to continue with verifying your account and setting a password.


Let's personalize your content