This site uses cookies to improve your experience. To help us insure we adhere to various privacy regulations, please select your country/region of residence. If you do not select a country, we will assume you are from the United States. Select your Cookie Settings or view our Privacy Policy and Terms of Use.
Cookie Settings
Cookies and similar technologies are used on this website for proper function of the website, for tracking performance analytics and for marketing purposes. We and some of our third-party providers may use cookie data for various purposes. Please review the cookie settings below and choose your preference.
Used for the proper function of the website
Used for monitoring website traffic and interactions
Cookie Settings
Cookies and similar technologies are used on this website for proper function of the website, for tracking performance analytics and for marketing purposes. We and some of our third-party providers may use cookie data for various purposes. Please review the cookie settings below and choose your preference.
Strictly Necessary: Used for the proper function of the website
Performance/Analytics: Used for monitoring website traffic and interactions
You could also use this opportunity to gather participant insights through surveys or feedback forms. 5 Tips For QR Code Success Mobile-First Design: Make sure all your linked content is optimized for mobile devices. 5 Tips For QR Code Success Mobile-First Design: Make sure all your linked content is optimized for mobile devices.
Our Organizational Excellence Survey revealed significant gaps in digital readiness, underscoring the need to prioritize technology now. Difficulty Measuring Success: Without analytics, its impossible to know if your efforts are working. Take the first step with our Future-Ready Survey and identify areas for improvement.
orgSource Digital Trends Survey highlights the essential strategies associations need to thrive in the coming years. Conduct surveys, gather feedback, and use data insights to understand what matters most to them. Implement Data Analytics : Leverage data analytics to track member behavior, event participation, and other key metrics.
Our recent.orgSource Digital Trends Survey reveals several key gaps in how associations are currently using technology to meet member needs and adapt to industry shifts. Our team designs innovative, tech-forward campaigns to help associations connect with members in meaningful ways. At.orgSource, we understand these challenges.
Whether the goal is donations, advocacy, or volunteer engagement, well-designed nonprofit marketing and communications can inspire action. Nonprofit Tech for Good) Design effective nonprofit marketing materials Next up is the fun partdesign. “Design is the silent ambassador of your brand.”
What goes into creating and designing a successful nonprofit website that inspires action? There are a few steps to successful audience-centric design: Identify Your Audience: Understand all of the groups your serve and find out what makes them tick. Engaging Visual Design. That’s a great question. Audience Analysis.
Analyze Member Engagement: Use surveys or focus groups to assess how well youre meeting member needs and expectations. How.orgSource Can Help: We help associations design timelines that keep projects on track while celebrating progress toward future readiness. Ready to take the first step?
Measuring Training Effectiveness with LMS Analytics Gyrus Systems Gyrus Systems - Best Online Learning Management Systems Introduction Companies use Learning Analytics Tools to collect, analyze, and measure the effectiveness of their learning and development programs. This can be measured through methods such as surveys.
Google Analytics :: analytics.google.com. Google Analytics is a freemium web analytics service offered by Google that tracks and reports website traffic. Nonprofits can use it to study past versions of their website and to monitor their progress in web design over time. For multilingual surveys, see Alchemer.
Bing Webmaster Tools :: bing.com/webmasters A free set of SEO, diagnostic, and reporting tools designed to improve your website’s rankings on Bing search results. Google Analytics :: analytics.google.com Google Analytics is a freemium web analytics service offered by Google that tracks and reports website traffic.
How to Leverage LMS Data Analytics for Better Decision-Making in Corporate Training GyrusAim LMS GyrusAim LMS - In today’s competitive business landscape, Learning and Development (L&D) programs are key drivers of employee growth, retention, and overall business success. billion in 2020–21.
Google Analytics :: analytics.google.com. Google Analytics is a freemium web analytics service offered by Google that tracks and reports website traffic. It is important to note that you must upgrade to Google Analytics 4 by July 1, 2023. The service provides analytics and easy integration with multiple third-party tools.
A website build or redesign has technical but also design and execution aspects. Well-defined technical and design scope and constraints. Step 3: Examine Analytics and Collect User Feedback. In addition to analytics, you will also need to get feedback from actual users of the site. Who will help with hands-on work?
When association leaders and staff want to gather information and opinions from their members, often the first idea is to conduct a member survey. If you survey your members too often, you create a condition called “survey fatigue.” If you survey your members too often, you create a condition called “survey fatigue.”
The analytics tools will also evaluate your posts to deduce the best possible times to share your content. The buttons are fully customizable and provides social share counts and analytics. Graphic Design & Photography. Create Market is an online marketplace of graphics design assets. Social Media.
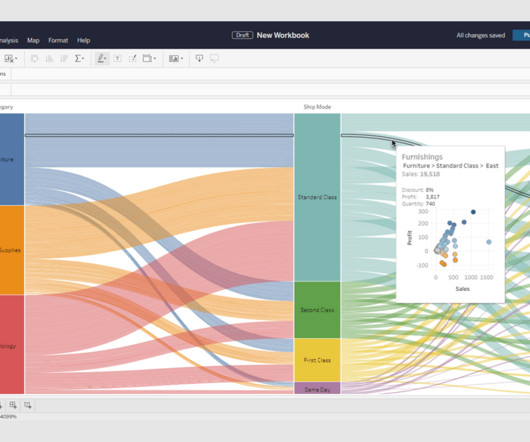
We wanted to empower the community to play an active role in the designing and developing their own viz types they use in Tableau. Viz Extensions extend the capabilities of what Tableau can visualize, adding more tools for people to explore insights and present information in entirely new designs and layouts.
The analytics tools will also evaluate your posts to deduce the best possible times to share your content. Specifically for nonprofits, Lightful is a social media management platform that enables organizations to schedule social media posts ahead of time and provides analytics to help organizations raise more awareness and funds.
It’s analytics tools will also evaluate your posts to deduce the best possible times to share your content. The buttons are fully customizable and provides social share counts and analytics. Graphic Design. Snappa is a simple-to-use graphics design tool with a built-in stock photo, illustration, and icons library.
By Maria De La Guardia , design director and brand strategist at Bureau for Good , a design agency that helps nonprofits explain why they matter across digital and print media. For more insights on branding, messaging, strategy, print and web design, sign up to receive Bureau for Good’s once-monthly articles here.
Product Marketing Manager, Embedded Analytics, Tableau. As a result, analytics dashboards and visualizations are beginning to appear everywhere: in consumer apps, business software, news sites, and more. Infusing analytics into user experiences is a way we can help our customers make smarter decisions and achieve greater success.
Product Marketing Manager, Embedded Analytics, Tableau. As a result, analytics dashboards and visualizations are beginning to appear everywhere: in consumer apps, business software, news sites, and more. Infusing analytics into user experiences is a way we can help our customers make smarter decisions and achieve greater success.
Step 2: Explore – In addition to reviewing the data in their dashboard, IAEE asked members in its annual member survey and in post webinar surveys about topics they’d like to learn more about. At IAEE, in looking at their data, the team noticed that a large segment of members with the CEM designation attended webinars.
Tech4Good Denver hosted an excellent and extremely informative group panel who shared true and tested content strategies when designing or managing your nonprofit’s website. Survey your friends and family to see how they describe all the wonderful things your nonprofit does. Here are the key takeaways from the session: 1.
This blog post will break down the essential steps for aligning KPIs with strategic goals and designing dashboards to monitor and share performance. Let’s break down three steps to aligning your strategic plan with tangible goals and designing dashboards that can help you monitor and share performance across your association and beyond.
Many organizations are challenged with scaling analytics to reach every employee and/or realizing the full value of their analytics investments. Organizations are investing trillions to become more data-driven, but only 8% successfully scale analytics to get value from their data, according to McKinsey. .
Use surveys or data analytics tools to better understand your constituents and tailor your fundraising messages accordingly. Preparing for Fundraising Before diving into fundraising, take a moment to evaluate your programs and services. What are your nonprofit’s core strengths?
Solutions Day One offers two sessions designed to help you assess your status and move ahead on the technology continuum. This day of total immersion designed specifically for association executives may not qualify you for the cyber Olympics, but it will go a long way toward putting you in the game.
Building design teams face a range of challenges during the design phase, from building higher while avoiding higher costs to reducing the time to occupancy. He’s the founder of BeamUP , a startup emerging from stealth that uses data to cut down design times and manage a facility’s systems over their lifecycle.
Have Google Analytics installed on your website (ideally, we recommend installing Google Tag Manage r as well). Have set up one or more “Goals” within Google Analytics for valuable actions that users can perform on your website (we will discuss this further in the “Conversion Tracking” section below) . This means that you: .
According to a survey by LinkedIn, 61% of U.S. HR analytics can bring objectivity to what is frequently a highly subjective process. Customize Present options designed to appeal to the people you interview. Present roles in ways that are designed to appeal to the variety of people you interview. I love that answer.
Smart analytics can show us both what members want in the moment and predict what they will need in the future. Outreach to our communities can be swift, targeted, and designed for the highest impact. Smart analytics can show us what members want in the moment and what they will need in the future.
In previous blog posts we’ve discussed responsive web design, formatting mobile friendly emails , and shown you even more statistics that will convince you to prioritize mobile sooner rather than later. ExactTarget – “The 2012 channel preference survey” (2012). O2 – “Mobile life report” UK (2013). Equinux (June 2013).
Here these questions are rhetorical, but you’ve likely all seen and responded to similar survey questions as you’ve traversed the web. Maybe you’ve even worked with the resulting datasets from those surveys. They’re not the only ones digging into the survey data. Visualise Our Survey Data. Calculations.
” Creating a consistent brand strategy isn’t a major investment and creating a shared style guide for marketing, design and sales generates positive ROI. Design and implement a content governance system to increase ROI. Abimbola Adebayo, founder and CEO, Pinnu Analytics. This makes measuring ROI tricky.”
Survey data reveals a significant 41% who are planning to adopt automated onboarding within 6-12 months. According to a survey, 56% of the participants believe onboarding automation software will certainly increase employees’ productivity.
Developers grapple with design and technical constraints; publishers and users might have different priorities when it comes to engaging with a service; the content of those services is changing all the time; and perhaps most of all, people are all different and so their experiences with an app will be, too.
While some surveys show that people prefer to talk to a human as opposed to a chatbot, whether they’re shopping online or dealing with a customer service issue, that hasn’t dissuaded companies from adopting them. A 2019 Salesforce report found that 53% of service organizations expected to use chatbots within 18 months.
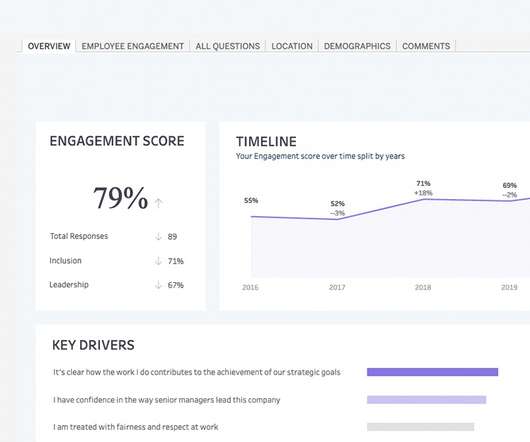
Culture Amp was founded in 2009 to let companies conduct anonymous employee surveys, but since then, its focus has expanded to helping employers turn the data they collect into action. Employee survey startup Culture Amp closes $82M round led by Sequoia China. The round bumps Culture Amp’s valuation to $1.5
Measuring Training Effectiveness with LMS Analytics GyrusAim LMS GyrusAim LMS - Companies use Learning Analytics Tools to collect, analyze, and measure the effectiveness of their learning and development programs. This can be measured through methods such as surveys. Do they find it useful?
Measuring Training Effectiveness with LMS Analytics GyrusAim LMS GyrusAim LMS - Companies use Learning Analytics Tools to collect, analyze, and measure the effectiveness of their learning and development programs. This can be measured through methods such as surveys. Do they find it useful?
Many organizations are challenged with scaling analytics to reach every employee and/or realizing the full value of their analytics investments. Organizations are investing trillions to become more data-driven, but only 8% successfully scale analytics to get value from their data, according to McKinsey. .
With 74% of student survey respondents saying that financial concerns were a challenge, students may be more tuned in to ensuring their degrees will lead to career opportunities. . Nearly a third (29%) of students surveyed in the Connected Student Report said more career resources are needed in order to be successful.
For example, you could survey lapsed donors to ask why they stopped donating. In addition, Bloomerang enables marketing and engagement campaigns through various solutions designed to help you create personalized, branded email communications.
They also surveyed their email subscribers, gathering detailed information that allowed them to better segment their audience and tailor their offerings. Conduct surveys and collect direct feedback from supporters and beneficiaries to gauge their satisfaction, test your messaging, and track your impact.
We organize all of the trending information in your field so you don't have to. Join 12,000+ users and stay up to date on the latest articles your peers are reading.
You know about us, now we want to get to know you!
Let's personalize your content
Let's get even more personalized
We recognize your account from another site in our network, please click 'Send Email' below to continue with verifying your account and setting a password.


Let's personalize your content