This site uses cookies to improve your experience. To help us insure we adhere to various privacy regulations, please select your country/region of residence. If you do not select a country, we will assume you are from the United States. Select your Cookie Settings or view our Privacy Policy and Terms of Use.
Cookie Settings
Cookies and similar technologies are used on this website for proper function of the website, for tracking performance analytics and for marketing purposes. We and some of our third-party providers may use cookie data for various purposes. Please review the cookie settings below and choose your preference.
Used for the proper function of the website
Used for monitoring website traffic and interactions
Cookie Settings
Cookies and similar technologies are used on this website for proper function of the website, for tracking performance analytics and for marketing purposes. We and some of our third-party providers may use cookie data for various purposes. Please review the cookie settings below and choose your preference.
Strictly Necessary: Used for the proper function of the website
Performance/Analytics: Used for monitoring website traffic and interactions
Tips to Step Up Your Salesforce Game Supercharge Segmentation with Advanced Analytics: Go beyond basic demographics: You’re likely already segmenting by basic factors like donation amount or location. Map the donor lifecycle: Visualize the stages donors go through from initial awareness to becoming loyal supporters.
Donor Journey Mapping is a process for helping organizations understand their current donor experience, identify opportunities to improve, and implement a plan to enhance it. They did their Donor Journey Mapping Homework by: Defining the audience: Donors who had the potential to make a $1k gift. Need help understanding your donors?
Gartner identifies these qualities as key to delivering value: A customer journey mapping process that extends beyond acquisition and purchase through the life of the relationship. The ability to accurately develop personas and create their journey maps. “Guessing about member preferences is not an option.
Explore how the strategic integration of SWOT analysis, audience mapping, SMART communication targets, channel identification, content strategy, execution and evaluation, and high-level communications planning can shape a successful digital transformation. With ChatGPT’s analytical prowess, the process can be augmented.
But before you can capitalize on the information stored in your CRM or other nonprofit software, you need to know exactly what analytics to track in the first place. This includes assisting with nonprofit analytics! Definition of Data Analytics for Nonprofits. 4 Types of Data Analytics. Web Analytics.
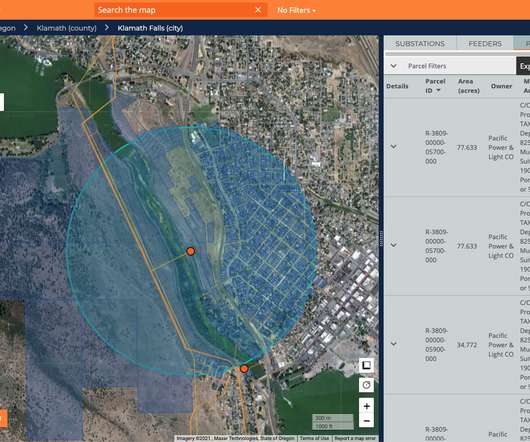
The company says it will use the funds to grow its team from 60 employees to around 100 by the end of 2021 and increase the deployment of its grid analytics tools. . Kevala has first mover advantage in providing comprehensive big data analytics on grid infrastructure,” said Zulfe Ali, managing partner at C5 Capital, in a statement.
How can Big Data Analytics help in delivering personalized learning? There are building evidence and compelling case studies demonstrating how data analytics can be leveraged to help organizations achieve better results for employees by customizing the learning experience.
How can Big Data Analytics help in delivering personalized learning? There are building evidence and compelling case studies demonstrating how data analytics can be leveraged to help organizations achieve better results for employees by customizing the learning experience.
How can Big Data Analytics help in delivering personalized learning? There are building evidence and compelling case studies demonstrating how data analytics can be leveraged to help organizations achieve better results for employees by customizing the learning experience.
The best way to measure that growth is with Google Analytics. Within your analytics dashboard head over to Acquisition -> All Traffic -> Channels. Another way to track organic page performance is to look at pages by clicks by navigating to Search Analytics in Google Search Console. Is the donation process frustrating?
Healthcare website visitors search for crucial medical advice, doctors’ names and contact information, a map of your facility, or other must-have information. You can improve your website’s user experience by mapping the user journey. Follow these steps to map user journeys: Create audience personas. Assess website analytics.
Your event marketing budget will be distinct from your event budget, and you’ll want to map out how much you can spend for each. . For example, if your entire demographic is on the social media platform Instagram, then your marketing budget should start with that, and then branch out to other avenues or pipelines depending on costs.
Accelerator Instant access to the best analytic solutions Tableau Accelerators are ready-to-use dashboards that you can combine with your data and customize to fit your needs to help you get to data-driven insights faster. If you want to look at your data geographically, you can plot it on a map in Tableau.
The platform combines data analysis, process mining and AI to offer predictive analytics to pharmaceutical and life sciences commercial teams. The startup was founded at the University of Toronto in 2018 after years of research and development in the areas of process mining, customer journey mapping and AI.
Tom will analyze demographic, fundraising and finisher data from the virtual Virgin Money London Marathon which has been awarded the Guinness World Records title for most users to run a remote marathon in 24 hours. . To learn about analytics… . This will help you pick your sessions. Do you want to hear about technology?
One of the more chilling innovations in marketing over the past few years is called “predictive analytics” It’s this blend of statistical analysis, data mining and psychology which enabled Target to conclude that a teenage girl was pregnant before her father did. But not all kinds of audience analysis are evil.
Your personas should include plenty of rich detail, such as each individual’s demographics, hobbies, and motivations. Map the website visitor journey. Use these resources to support your research process: Google Analytics. Map the website visitor journey. Create clear user pathways or maps for each persona.
Map out your marketing strategy (including when speakers are announced and ticketing sales). Gamification ideas should have rewards, interaction, an element of analytics, and they should be fun! Link everything to analytics for future marketing success! Try to scout some presenters and keynote speakers. Find a venue and vendors.
By ensuring accurate and up-to-date information on Google Maps and a robust Google Business profile, you can enhance your organization’s visibility in local searches, making it easier for local individuals to find your relevant services, events, or causes.
“By far one of the biggest demographic changes in our time and in history will be the mega city,” Haggiag said. “Transport agencies understand that most of the world uses apps like Google Maps so the first focus is to make sure that the data is super accurate for those,” Amos Haggiag.
Understanding Your Donors To strengthen ties with supporters and build lasting relationships, consider starting with two key strategies: crafting donor personas and leveraging data analytics. Move beyond basic demographics to understand motivations, interests, and communication preferences.
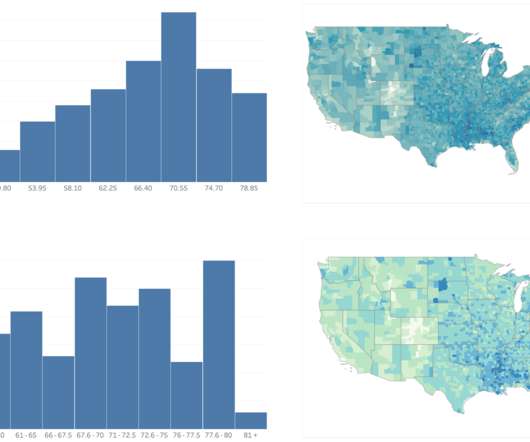
Selecting the correct number of bins for a chart or map is often portrayed as a tradeoff. For example, the three maps below all show the same underlying data: the percent population of each U.S. The left map in Figure 1 shows a continuous color ramp—where each of the ~3000 counties is represented by a shade unique to its data value.
Selecting the correct number of bins for a chart or map is often portrayed as a tradeoff. For example, the three maps below all show the same underlying data: the percent population of each U.S. The left map in Figure 1 shows a continuous color ramp—where each of the ~3000 counties is represented by a shade unique to its data value.
Here are the steps within this milestone: Detailed site analytics review: Our team examines your site analytics to better understand your current traffic sources, user demographics, and behavior patterns.
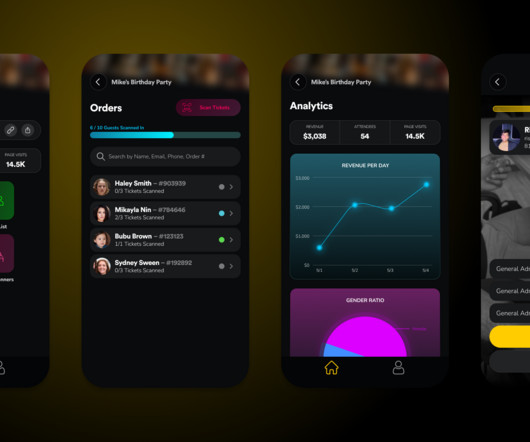
The platform is designed to provide an all-in-one, self-serve platform for organizers to create white-labeled event pages, send out unlimited text blasts and emails to eventgoers, and access custom payment plans, community management features and analytics like attendee demographics, tracking link data and more.
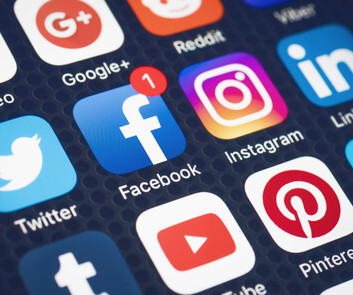
Look for patterns, demographics, and behavioral insights of your current donor base. As always, different social media platforms cater to different user demographics. While the platform’s user base runs the gamut in terms of age, it’s most useful for reaching an older demographic.
Or dig into demographic data to understand whether factors like age, gender, and income affect who gives and how they give? Maybe it's answering a question as simple as mapping where all your top donors live in a particular city? A visual analytics tool will help you answer these kinds of questions much more quickly.
By analyzing thousands of news reports, it provides a near real-time, searchable map of gun violence, with over 75 filterable categories such as type of shooting, firearm used, and demographics of those involved.
Whether you’re analyzing patient outcomes, tracking academic trends, or gathering insights from donor demographics, data visualization can be a valuable tool for any organization. Map the data journey: Determine how each audience segment interacts with your data by mapping their workflows and identifying key touchpoints.
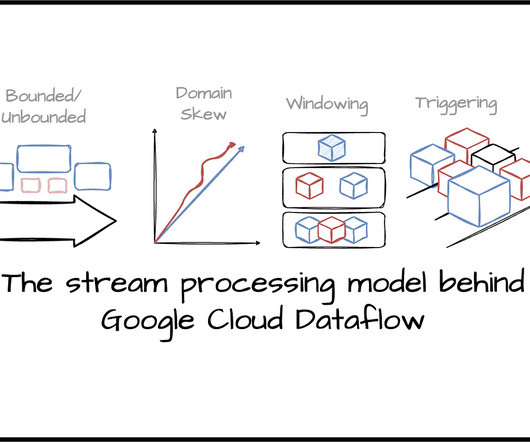
They want to know how often and for how long their videos are being watched, with which content/ads, and by which demographic groups. On the other hand, some operations on unbounded data don’t need the window notion, like filtering, mapping, or inner join. Sessions are a critical use case within Google.
For example, you can identify prospects to reach out to through direct messages or use demographic information to develop more specific campaigns. Use your audience personas as a guide map for your campaigns. Many social media platforms will also provide additional analytics to help you evaluate your posts’ performance.
” For nonprofits, this shows the value of thoroughly researching your donors’ demographics, history, and motivations before crafting appeals. Google Analytics is a must-use tool to help understand your campaign performance. Use surveys and donor journey mapping to understand how people engage initially and over time.
Additionally, Flipcause’s donation processing capabilities include robust reporting and analytics tools, allowing you to track and analyze donation data in real-time. Next, map out a timeline for your campaigns, considering key dates like Giving Tuesday, Thanksgiving, and end-of-year giving.
However, this would be like starting a road trip without a map. To prepare for the planning stage, get to know your donors by: Using data analytics tools. Include supporter data such as: Demographics Psychographic traits (e.g., You could get lost, double your travel time, or end up at the wrong destination.
By using data and analytics to track donor behavior and preferences, you can tailor their communication and fundraising strategies to better engage and retain your donors. Fundraising How To Create a Donor Journey Map and Cultivate Recurring Giving 11 min read Read Now 3. Effective donor management is crucial for nonprofits.
It was a chance to have an open conversation on the technological, social, demographic, and marketplace changes coming fast and furious to the healthcare sector – and apply them to the healthcare marketing space. Some of our main takeaways and areas for your consideration are: .
By using GivingDNA, the agency discovered their constituents philanthropic affinities, wealth, and personal demographics and identified specific groups for targeted communications. Visualize the donor journey: To help colleagues or leadership who may be skeptical of establishing a mid-level program map the donor journey for them.
Use DonorSearch’s tools to develop perfect marketing outreach lists of supporters based on 300 financial, demographic, and interest categories. Heat mapping. A Google Maps integration allows your organization to develop heat maps based on congregations of supporters in local areas so you know where to geographically reach them.
Demographics . As seen with the importance of creating a marketing strategy, mapping out a content strategy allows you to identify what’s working and what needs further attention down the road. . Marketing analytics uses accurate data to improve and optimize campaigns , ultimately driving a higher return on investment (ROI).
Databases and Analytics. Azavea's OpenTreeMap app allows individuals, governments, neighborhood organizations, and other groups to collaborate in mapping and exploring the urban forest ( iOS and Android ; free). Esri offers a broad collection of apps for interacting with GIS, demographic, and touring data.
Plus, they offer unique and impactful tools to help universities juggle prospect management, gift processing, reporting and analytics, constituent relations, donor bio/demographics, and more. Predictive analytics reporting using Salesforce Einstein and other AI-based platforms to provide fundraisers with smarter insights.
Google Maps and Earth features that allow you to map your projects and progress on these platforms. There are three main factors which affect whether your ads will appear in search results; The way you target your ads (such as by location or demographic). This is done through analytics and conversion tracking. Why Twenti?
Fastest growing demographic is 35 and older. > Rebecca Moore then discussed at length the new generation of online (and easy to use) mapping tools – “neo geography” – and how it helps to communicate to and mobilize others through data visualization. The tools and points she covered included: Social Networks.
If you have the budget, you might even consider a donor survey, not to collect demographic data on all of your donors, but to collect specific information about specific donors. Map out the journeys of these donors based on the giving triggers and how they have interacted with the foundation. Step 2: Modelling. Enough said.
We organize all of the trending information in your field so you don't have to. Join 12,000+ users and stay up to date on the latest articles your peers are reading.
You know about us, now we want to get to know you!
Let's personalize your content
Let's get even more personalized
We recognize your account from another site in our network, please click 'Send Email' below to continue with verifying your account and setting a password.


Let's personalize your content