This site uses cookies to improve your experience. To help us insure we adhere to various privacy regulations, please select your country/region of residence. If you do not select a country, we will assume you are from the United States. Select your Cookie Settings or view our Privacy Policy and Terms of Use.
Cookie Settings
Cookies and similar technologies are used on this website for proper function of the website, for tracking performance analytics and for marketing purposes. We and some of our third-party providers may use cookie data for various purposes. Please review the cookie settings below and choose your preference.
Used for the proper function of the website
Used for monitoring website traffic and interactions
Cookie Settings
Cookies and similar technologies are used on this website for proper function of the website, for tracking performance analytics and for marketing purposes. We and some of our third-party providers may use cookie data for various purposes. Please review the cookie settings below and choose your preference.
Strictly Necessary: Used for the proper function of the website
Performance/Analytics: Used for monitoring website traffic and interactions
Limited Integration Between Systems : If your CRM, email marketing, and membership databases dont communicate with each other, you may be missing opportunities for efficient, personalized member engagement. Data analytics can help you anticipate changes and adapt proactively. This slows down operations and increases the risk of errors.
Seeing which way people’s actions are trending, seeing what younger members want versus older members and how they engage, this is where analytics can be the dowsing rod for your organization. Leaders (Should) Want Metrics When you talk with any executive, often its results they want, not information on how the sausage is made.
You probably have a long list of great things you want to accomplish this year…including making analytics a priority. We can help you move analytics to the top of the list by giving you tips to build a business case and how to articulate it to others. Let’s build your business case to make data analytics a top priority: 1.
Imagine what your organization could accomplish in 2022 if you began each initiative with clean, streamlined donor records that record donations from your online forms and update automatically , an arsenal of canned reports to track key metrics, and a solid plan to prioritize each donor segment individually. Giving Tuesday.
With the popularization of real-time database technologies, stale data and the problems surrounding it might soon become a thing of the past — if vendors’ sales pitches are to be believed. As evidenced by the larger and larger funding tranches, investors believe that there’s a sizeable market for real-time databases.
At Association Analytics, we sometimes hear concerns about data quality in the context of associations starting their journey into analytics. To help alleviate your fear of dirty data, we have some tips on how to tackle cleaning it up and getting your database in great shape. You can even start with data analytics.
In late 2013, Errplane, a Y Combinator-backed startup, began developing an open source project called InfluxDB for database performance monitoring and alerting. Imply , another real-time database vendor, closed a $100 million Series D round in May that values the company at a $1.1 billion post-money.
Rockset , a cloud-native analytics company, announced a $40 million Series B investment today led by Sequoia with help from Greylock, the same two firms that financed its Series A. Rockset supplied a few metrics to illustrate this. Series D as scalable database resonates. The startup has now raised a total of $61.5
This week, Gartner published the 2021 Magic Quadrant for Analytics and Business Intelligence Platforms. In every release, we're making Tableau easier to use, more powerful, and simpler to deploy to support governed data and analytics at scale. Accelerate adoption with intuitive analytics that people love to use.
release includes features that give developers an easier embedded analytics experience and more control over authentication. Let’s dive into the capabilities that help you empower users with self-service analytics in your applications. Get more control while scaling self-service with an easy, modern embedded analytics experience.
Just as you’ve finally settled into the shift from Universal Analytics (UA) to Google Analytics 4 (GA4) and started to get a handle on its new metrics, Google has yet another deadline for organizations to meet. On July 1, 2024, Google will permanently remove access to all Universal Analytics data.
You can track metrics that will help you identify what’s working, including social media engagement, impressions and reach, database growth, event registration and attendance, and website visits and sessions. The post Create a Winning New Member Strategy in 3 Easy Steps appeared first on Association Analytics.
But before you can capitalize on the information stored in your CRM or other nonprofit software, you need to know exactly what analytics to track in the first place. This includes assisting with nonprofit analytics! Definition of Data Analytics for Nonprofits. 4 Types of Data Analytics. Web Analytics.
From Enormous Data back to Big Data Say you are tasked with building an analytics application that must process around 1 billion events (1,000,000,000) a day. How you transition from a batch mindset to a streaming mindset although can also be tricky, so let’s start small and build. Time is of the essence. The speed to resolution matters.
release includes features that give developers an easier embedded analytics experience and more control over authentication. Let’s dive into the capabilities that help you empower users with self-service analytics in your applications. Get more control while scaling self-service with an easy, modern embedded analytics experience.
However, most board members aren’t familiar with various fundraising metrics and won’t be able to draw effective conclusions when they’re presented with data without an explanation of what the data shows. . The last thing you want to do is waste their time and bog their donor reports down with unnecessary metrics. .
A suite of tools, apps, and connectors that helps transform disconnected data into clear, engaging, and interactive visuals, Power BI allows you to pull from an open data source—could be from an Excel spreadsheet or a cloud-based CRM system or a federal database—so you can more easily aggregate, visualize, and interpret your data.
. “Operational analytics” Fast-forward to April 2021, and the commercial MergeStat company was officially born, with DeVivo going on to lure Josue Lopez from cloud giant Equinix to serve as chief operating officer (COO), as well as official cofounder. Example pull request (PR) data derived via MergeStat.
AI-powered tools , such as data integration platforms and robotic process automation (RPA) software, can automate these tasks, extracting data from multiple sources, standardizing it, and integrating it into a centralized database. This has empowered us to make data-driven decisions that have enhanced our impact in the communities we serve.
offers a ton of exciting updates and new features to better support secure, connected analytics in the flow of your business—and of course, some delightful capabilities to help you work faster and get more value from your data. Connected Apps simplifies the authentication experience for embedded analytics content. December 10, 2021.
offers a ton of exciting updates and new features to better support secure, connected analytics in the flow of your business—and of course, some delightful capabilities to help you work faster and get more value from your data. Connected Apps simplifies the authentication experience for embedded analytics content. December 10, 2021.
Tricia Marsherall is the Founder & President of Marsherall Partners, LLC, a consulting firm specializing in nonprofit donor database management & operations support and virtual & traditional fundraising events. Analytics can be an extremely powerful tool for generating reports. What Caused Your Data Nightmare to Begin With?
If you love flexible, cloud database schemas and analyzing maps, then Tableau offered you a lot in 2021. This feature introduced the opportunity to curate and organize your data and analytics content exactly the way you like. And that’s just the beginning—learn more about what else is coming in Slack-first analytics.
NewVantage Partners’ 2022 poll of chief data and analytics officers found that less than half (47.4%) believed that they’re competing on data and analytics. With Omni, we’re filling the gap between instant-gratification analytics and the reliability and governance of mature enterprise BI.”
Assess Reporting and Analytics Capabilities Data-driven decision-making is essential for optimizing compliance training programs. Organizations should seek LMS solutions that offer comprehensive reporting and analytics features , enabling them to: Monitor training effectiveness and completion rates.
Last week, we launched one of the most important pieces of the system for our team; the back-end analytics dashboard. One of the key metrics we obsess over is the referral rate organizations are experiencing from their ActionSprout campaigns. As we push the dashboard live, we were excited and nervous.
Key fundraising metrics like donor retention rate, donation frequency, and fundraising return on investment (ROI). These metrics provide a comprehensive, bird’s eye view of your organization’s fundraising and outreach efforts that you can use to craft a new strategy. The characteristics of your donor base.
If you love flexible, cloud database schemas and analyzing maps, then Tableau offered you a lot in 2021. This feature introduced the opportunity to curate and organize your data and analytics content exactly the way you like. And that’s just the beginning—learn more about what else is coming in Slack-first analytics.
Across industries, organizations have been investing heavily to integrate analytics throughout every aspect of their company to capture a portion of the $9.5 trillion value that the McKinsey Global Institute estimates advanced analytics can enable. trillion to $15.4
Enrich your database. Deep Sync defines data enrichment as “the process of supplementing your first-party data with third-party data to confirm you have the most accurate, reliable, and comprehensive database possible.” With a well-rounded database, it’s time to create your segments and put them to use. Event communications.
QUESTION: Caity talked about calculating the ‘growth score’, then used an example of the benefit of moving that metric just 2%. Second, how easy is it to get your data OUT of the CRM database – not get into, but get it out, whether you need to run analytics, feed another system, or even migrate to a new solution.
Connectors enable Tableau to access additional databases and applications. Formerly called Dashboard Starters, Accelerators include pre-built dashboards that help you dive straight into problem solving and create robust visualizations in minutes—even if you don’t consider yourself an analytics expert.
Our unique approach to data fabric converges a data management layer within our analytics platform—which data consumers already use and love—so you can govern and secure a federated environment and enable broad self-service without disrupting the flow of business. Here’s a look at what we provide today. Collaborate and drive adoption .
Our unique approach to data fabric converges a data management layer within our analytics platform—which data consumers already use and love—so you can govern and secure a federated environment and enable broad self-service without disrupting the flow of business. Here’s a look at what we provide today. Collaborate and drive adoption .
The post provides some great recommendations on dashboard design, but also illustrates how to link your objectives, metrics, and KPIs to dashboard design. These become the metrics & KPIs behind our work. We are currently using these data sources: Google Analytics (export). Daniel Chase. Click to see larger image.
Nonprofit pros and analytics teams know that collecting data is the easy part. Drawing on their deep experience in healthcare fundraising and consulting, analytics experts Liza Turcotte and Julian Heidelberg break down how to make data work for your cause, including: Focusing on best practices throughout the donor cycle.
Using that knowledge, we’ve created this guide to help your team understand major gift KPIs, the metrics you should be tracking, and the top tips to do so successfully. You’ll explore major gift metrics through the following guide: Overview of Major Gift Fundraising Data. 3 Tips to Track Major Gift Metrics More Effectively.
Nonprofit engagement metrics can help you understand your organization, but you’ve probably seen the same terms over and over again in your research. By embracing a few overlooked metrics, you will be able to go deeper into that information. By embracing a few overlooked metrics, you will be able to go deeper into that information.
You can calculate this metric for your organization by dividing the number of donors who gave again this year by the total number of donors who gave last year. . Use your donor database and communication tools–like an email marketing platform, if you have one–to segment or group donors based on shared characteristics.
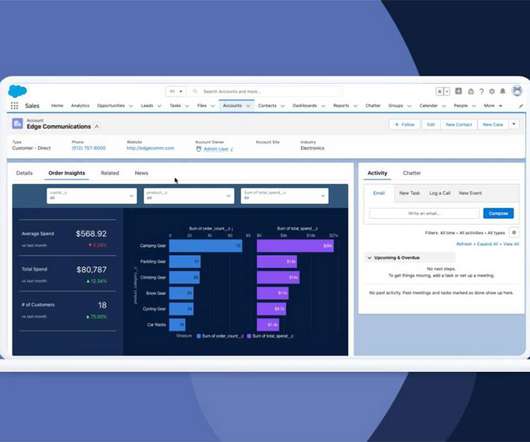
Salesforce CDP creates holistic customer views by pulling data from internal and external databases and building unified customer profiles. From there, Tableau CRM provides actionable insights and AI-driven analytics empowering people to make the best decisions for their customers. . Getting started with CDP Direct.
Salesforce CDP creates holistic customer views by pulling data from internal and external databases and building unified customer profiles. From there, Tableau CRM provides actionable insights and AI-driven analytics empowering people to make the best decisions for their customers. . Getting started with CDP Direct.
Accelerator Instant access to the best analytic solutions Tableau Accelerators are ready-to-use dashboards that you can combine with your data and customize to fit your needs to help you get to data-driven insights faster. You can see the impacts of joins as you create data sources or write back to your database. table or workbook).
A highly efficient evolution of the traditional customer database, a CRM system can do so much more than keep your address book updated. To connect supporters to your cause, in-depth analytics tools in a CRM system can help fundraisers and development staff identify donor churn so they can address the drop-off points.
Before you begin any project involving data analysis, start by clearly outlining your goal so you know which metrics to analyze. After you implement new strategies, regularly check your monthly giving program’s success metrics. Understand donors’ giving behaviors. Monitor data and adjust your appeals. Determine your objectives.
We organize all of the trending information in your field so you don't have to. Join 12,000+ users and stay up to date on the latest articles your peers are reading.
You know about us, now we want to get to know you!
Let's personalize your content
Let's get even more personalized
We recognize your account from another site in our network, please click 'Send Email' below to continue with verifying your account and setting a password.


Let's personalize your content