This site uses cookies to improve your experience. To help us insure we adhere to various privacy regulations, please select your country/region of residence. If you do not select a country, we will assume you are from the United States. Select your Cookie Settings or view our Privacy Policy and Terms of Use.
Cookie Settings
Cookies and similar technologies are used on this website for proper function of the website, for tracking performance analytics and for marketing purposes. We and some of our third-party providers may use cookie data for various purposes. Please review the cookie settings below and choose your preference.
Used for the proper function of the website
Used for monitoring website traffic and interactions
Cookie Settings
Cookies and similar technologies are used on this website for proper function of the website, for tracking performance analytics and for marketing purposes. We and some of our third-party providers may use cookie data for various purposes. Please review the cookie settings below and choose your preference.
Strictly Necessary: Used for the proper function of the website
Performance/Analytics: Used for monitoring website traffic and interactions
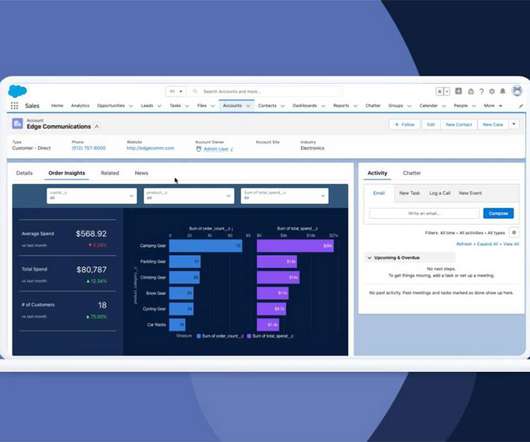
By combining the power of its CRM with integrated data and cutting-edge artificial intelligence, Salesforce empowers nonprofit organizations of all sizes to cultivate deeper relationships with donors through hyper-personalized engagement. One tip is migrating over the most important subset of data like the last 3-5 years of giving history.
Any company that tells you that all your data should reside exclusively in a CRM they will shoe-horn you into is stretching the truth at best. With AI built into its core operation, HubSpot offers you new insights into your donor data along with intuitive tools to guide your work. Are these platforms powerful and extensible?
While usage is a great data point to evaluate your product’s success, there’s so much more to consider when weighing the options to build an in-house solution or use an off-the-shelf product. Additionally, it’s critical that the project road map is managed meticulously to avoid risk of delays that can lead to cost overruns.
Donor Journey Mapping is a process for helping organizations understand their current donor experience, identify opportunities to improve, and implement a plan to enhance it. The team at Intermountain Health used their existing donor data to identify the new donors they wanted to focus on. Need help understanding your donors?
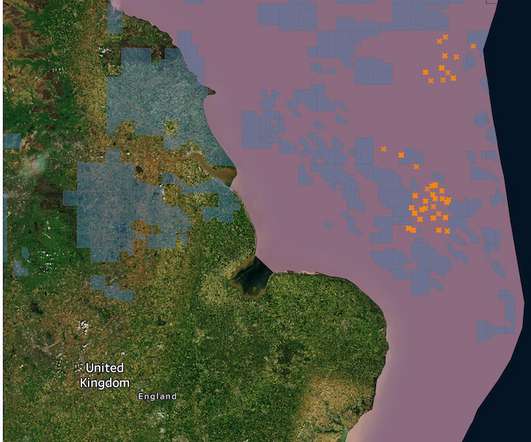
Efficient geospatial manipulations for OSM mapdata Photo by Tabea Schimpf on Unsplash If you’ve worked with OSM data before, you know it’s not the easiest to extract. OSM data can be huge, and finding performant solutions for what you want to analyze is often a challenge. Let’s get into what this library can do! ?
Today’s question comes from a nonprofit employee who wants advice on whether or not it’s worth it to invest in digital analytics tools. . They want us to invest in digital analytics tools to measure our efforts, but I’m not really sure what this will tell us. The road to digital analytics maturity.
In particular, the new multiple marks layers feature lets you add an unlimited number of layers to the map. This means you can visualize multiple sets of location data in context of one another, and there’s no need for external tools to build custom background maps. . Drag and drop map layers—yes, it’s just that easy.
Many companies collect a ton of data with some location element tied to it. Carto lets you display that data on interactive maps so that you can more easily compare, optimize, balance and take decisions. A lot of companies have been working on their data strategy to gain some insights.
Many data sets include location details, such as addresses, country names, or named sales territories. Mapping these location elements allows for visualization, exploration, and communication about the spatial patterns in the data—helping us to better understand the world around us. . July 8, 2022.
Note: The purpose of this document is to both outline new Google Analytics 4 (GA4) functionality and develop a set of M+R recommendations. Analytics are an essential tool for digital marketers and there’s a big shift underway as Google Analytics 4 (GA4) is being implemented. Universal Analytics (a.k.a. Event Types.
It presents itself in the form of permission-based tools, such as device IDs, cookies, Geo-location, and IP mapping. For instance, a cookie can trace a customer on a site and provide a re-targeting ad later using its data. You will be unable to know their useful marketing data, gender, or age.
Many organizations are challenged with scaling analytics to reach every employee and/or realizing the full value of their analytics investments. Also, the exponential amount of data they’re generating creates additional complexity to helping employees use data in their roles. in data-aware organizations. .
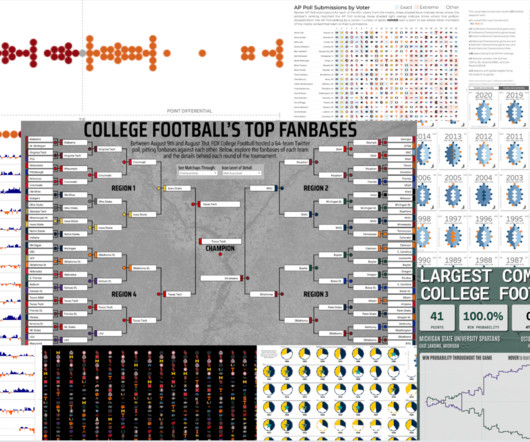
My journey into the world of data visualization has led me to embrace a unique passion: college football. Now, after over three years of engaging with the #DataFam on Tableau Public , I'm excited to present a curated collection of college football data visualizations that capture the sport's essence like never before.
The annual M+R Benchmarks Study is a wide-ranging exploration of digital fundraising, advocacy, and marketing data. Participation primarily involves collecting and coding a big stack of data, which our analytics team will combine (anonymously!) Your data security and anonymity are VERY IMPORTANT to us.
When you migrate to Salesforce, you become deeply familiar with your organization’s data—the volume, the quality, and the insights it can provide. You carefully analyze and map your legacy data, populating your new system until it’s full of your organization’s history. The Role of a Data Warehouse.
Gartner identifies these qualities as key to delivering value: A customer journey mapping process that extends beyond acquisition and purchase through the life of the relationship. The ability to accurately develop personas and create their journey maps. The data results in business intelligence that better meets customer needs.
Productivity analytics startup Time is Ltd. wants to be the Google Analytics for company time. Whatever the case, the founders reckon that if you can map how time is spent in a company, enormous productivity gains can be unlocked and money better spent. Or perhaps a sort of “Apple Screen Time” for companies.
Analyzing data generated within the enterprise — for example, sales and purchasing data — can lead to insights that improve operations. But some organizations are struggling to process, store and use their vast amounts of data efficiently. ” Pliops isn’t the first to market with a processor for dataanalytics.
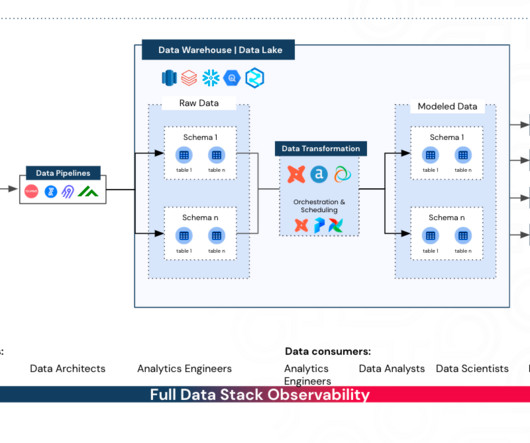
Data Entropy — More Data, More Problems? How to navigate and embrace complexity in a modern data organisation. Business users are unable to find and access data assets critical to their workflows. Data engineers spend countless hours troubleshooting broken pipelines. Every “minor” change upstream results in mayhem.
brings practical enhancements to make analytics in your organization more seamless and scalable. release : Prep your data all in one integrated platform on the web with Tableau Prep Builder in the browser. Prep your data wherever you have access to a browser. Tableau 2020.4 Starting in 2020.4, Less is more?
This week, Gartner published the 2021 Magic Quadrant for Analytics and Business Intelligence Platforms. I first want to thank you, the Tableau Community, for your continued support and your commitment to data, to Tableau, and to each other. Accelerate adoption with intuitive analytics that people love to use. February 18, 2021.
The key for startups looking to defend the quarter from disruptions is to adopt a proactive, data-driven approach to inventory management. Here are five methods we’ve been counseling clients to adopt: Use data and analytics to identify and map out the inventory being affected by the global shipping crisis.
The answer: craft your own strategy that uses your data, is customized to your audience, and won’t overwhelm your team (or yourself). Here is how you can craft a road map to social media success. Instead of turning to expert advice, look at your own social media data from the past year. This is your road map.
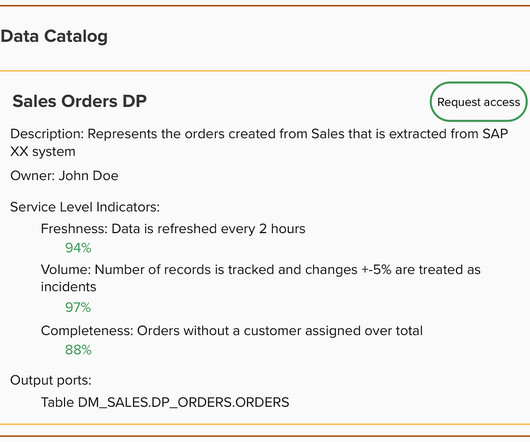
How to Identify Your Business-Critical Data Practical steps to identifying business-critical data models and dashboards and drive confidence in your data Source: synq.io This article has been co-written with Lindsay Murphy Not all data is created equal. There’s a good reason for this. Source: synq.io
Explore how the strategic integration of SWOT analysis, audience mapping, SMART communication targets, channel identification, content strategy, execution and evaluation, and high-level communications planning can shape a successful digital transformation. With ChatGPT’s analytical prowess, the process can be augmented.
Collecting data and surfacing insights are essential to meeting customer expectations. The ability to combine data generated by customer interactions helps organizations better anticipate needs and deliver more integrated and personalized experiences. Accelerate data prep without a connector. Anirudh Sridhar. Bronwen Boyd.
Collecting data and surfacing insights are essential to meeting customer expectations. The ability to combine data generated by customer interactions helps organizations better anticipate needs and deliver more integrated and personalized experiences. Accelerate data prep without a connector. Anirudh Sridhar. Bronwen Boyd.
Struggling to articulate the value of your data team? Learn how to calculate your data team’s return with the Data ROI Pyramid. As recently as a year ago, about half of the data leaders I spoke with felt the business value of their team sold itself. Calculating data ROI Image by author. Image by author.
To achieve this, the government’s been working with Civis Analytics , the data science company founded by Dan Wagner , who was previously chief analytics officer for Barack Obama’s 2012 reelection campaign. Eric Schmidt-backed data science startup Civis Analytics raises $22M. Is it working?
brings new and improved ways to interact with your data to ensure everyone across your organization can ask meaningful questions and get valuable answers from their data. Upgrade now to take advantage of these new innovations, and get the most from your data with our latest augmented analytics features. Tableau 2021.2
This generalisation makes their data models complex and cryptic and require domain expertise. Even harder to manage, a common setup within large organisations is to have several instances of these systems with some underlaying processes in charge of transmitting data among them, which could lead to duplications, inconsistencies, and opacity.
Taken together, these data points make it clear: your website can play a significant role in building meaningful, long-term supporter relationships. This makes it easier for the agency to map out intuitive navigation. Data-Driven Improvements : A strategically built site makes it easier to track user behavior.
My journey into the world of data visualization has led me to embrace a unique passion: college football. Now, after over three years of engaging with the #DataFam on Tableau Public , I'm excited to present a curated collection of college football data visualizations that capture the sport's essence like never before.
Consider the digital components of these services—from benchmarking data reports to affinity partner discounts; from webinars to grants; from case work to fundraising; from research and policy to programs. The result is a digital ecosystem plan : a map of complementary digital products and services aligned with your mission goals.
Fitbit activity analysis with DuckDB Photo by Jake Hills on Unsplash Wearable fitness trackers have become an integral part of our lives, collecting and tracking data about our daily activities, sleep patterns, location, heart rate, and much more. What insights are buried within my archive of personal fitness activity data?
Nimble Intelligence According to Community Brands research, 55% of associations say investing in business intelligence and dataanalytics is a top priority. Stand apart from the competition by serving your members faster and delivering insights with an AI-powered analytics solution that enhances standard reporting.
The analytics tools will also evaluate your posts to deduce the best possible times to share your content. Specifically for nonprofits, Lightful is a social media management platform that enables organizations to schedule social media posts ahead of time and provides analytics to help organizations raise more awareness and funds.
In partnership with AiFi , a startup that aims to enable retailers to deploy autonomous shopping tech cost-effectively, Microsoft today launched a preview of a cloud service called Smart Store Analytics. It might sound like a lot of personal data Smart Store Analytics is collecting.
Innovation is necessary to use data effectively in the pursuit of a better world, particularly because data continues to increase in size and richness. And with this work, I invite discussions about this history, my analysis, and the implications for the future of analytics. December 1, 2021 - 11:06pm. December 2, 2021.
Data Culture is foundational to building a data-driven organization, but what, exactly, does a successful Data Culture look like? At Tableau Conference , leaders from the Seattle Seahawks, VMWare, and Jaguar Land Rover (JLR) shared examples of successful Data Cultures in action. Replace “data” with “knowledge”.
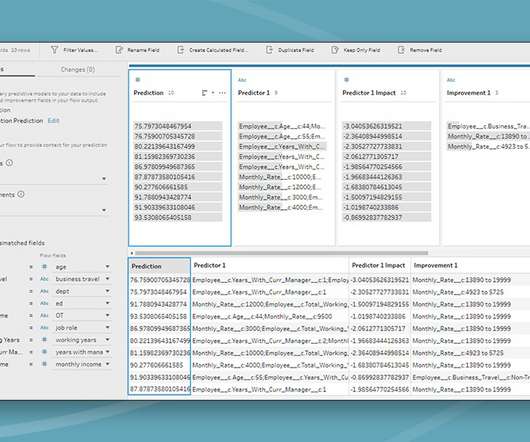
In the April release of Tableau Prep, you can now invoke the power of Salesforce Einstein Discovery to bulk score your data directly in your flow. With this integration, you can apply predictive machine learning models built in Einstein Discovery to your flow data, then generate predicted outcomes directly in your flow.
The analytics tools will also evaluate your posts to deduce the best possible times to share your content. The buttons are fully customizable and provides social share counts and analytics. Google Analytics :: analytics.google.com. Mapme is a web-based platform for creating, sharing, and embedding online maps.
It’s analytics tools will also evaluate your posts to deduce the best possible times to share your content. The buttons are fully customizable and provides social share counts and analytics. Mapme is a web-based platform for creating, sharing, and embedding online maps. Social Welfare :: warfareplugins.com. Photo Editing.
Data hygiene projects This can range from cleaning and completing Salesforce, spreadsheet, CRM or other databases for stakeholders. The safest way to have interns participate in social media is to have them analyze the data and then come up with sample posts for the platform.
We organize all of the trending information in your field so you don't have to. Join 12,000+ users and stay up to date on the latest articles your peers are reading.
You know about us, now we want to get to know you!
Let's personalize your content
Let's get even more personalized
We recognize your account from another site in our network, please click 'Send Email' below to continue with verifying your account and setting a password.


Let's personalize your content