This site uses cookies to improve your experience. To help us insure we adhere to various privacy regulations, please select your country/region of residence. If you do not select a country, we will assume you are from the United States. Select your Cookie Settings or view our Privacy Policy and Terms of Use.
Cookie Settings
Cookies and similar technologies are used on this website for proper function of the website, for tracking performance analytics and for marketing purposes. We and some of our third-party providers may use cookie data for various purposes. Please review the cookie settings below and choose your preference.
Used for the proper function of the website
Used for monitoring website traffic and interactions
Cookie Settings
Cookies and similar technologies are used on this website for proper function of the website, for tracking performance analytics and for marketing purposes. We and some of our third-party providers may use cookie data for various purposes. Please review the cookie settings below and choose your preference.
Strictly Necessary: Used for the proper function of the website
Performance/Analytics: Used for monitoring website traffic and interactions
Set Clear, Measurable Goals: Define success metrics that are specific, actionable, and adaptable as your association grows and evolves. Identify Skill Gaps: Determine where training is needed, particularly in digital literacy and data analysis, to equip your team for success.
If your nonprofit doesn’t do this kind of record-keeping and analysis, the good news is that it is never too late to start! . Any number of excellent software solutions and nonprofit tools exist to help with this kind of analysis. The intention of this metric is to identify inefficiencies and wasteful spending.
Set Clear Goals and Metrics : Define what success looks like in terms of member engagement, satisfaction, and retention. Track these metrics over time to adjust your strategy as needed. Implement Data Analytics : Leverage data analytics to track member behavior, event participation, and other key metrics.
Organizations have shared more than 43,000 metrics, which demonstrate how nonprofits measure the difference they make in the world. . Who shares their metrics? . What kinds of metrics are shared? . Platinum Seal holders provide, on average, three metrics. The most frequently used metrics are : .
The Tableau Exchange is your one-stop-shop for offerings to jumpstart your data analysis to answer questions and get actionable data quickly. We’ve added Accelerators that help you dig into metrics like patient wait time, the seasonality of admission rates, and readmission rates, and more. Take our healthcare offerings, for example.
Let’s see what engagement metrics gain the most significant interest from investors. Engagement over long periods at the end of a subscription There are many engagement metrics to look at. The obvious metric to review is how often your user opens the app toward the end of the period in question.
Deciding which metrics matter most for your startup. In this last part of my five-part series , we’ll cover how to determine which metrics matter for your startup. It’s very easy to get lost if you assume upper-funnel metrics are the most crucial for your startup. Don’t fall into this trap. They would be wrong.
Cohort analysis is a way of evaluating your business that involves grouping customers into “cohorts” and observing how they behave over time. Cohort analysis gives you a multivariable, forward-looking view of your business compared to more simple and static values like averages or totals.
Having measurable metrics is crucial to pinpoint what is and isn’t working in training development programs. Measurable training metrics may include completion rates, engagement rates, course evaluations, and assessment scores. It helps them know if they are using time and resources wisely.
And yet SMART goals are so crucial in data analysis because they provide direction needed for inquiry. For example, knowing that you want to increase a specific type of membership can make all the difference in measurement, analysis, and strategy. What metrics could you use to predict whether you will achieve your goals ?
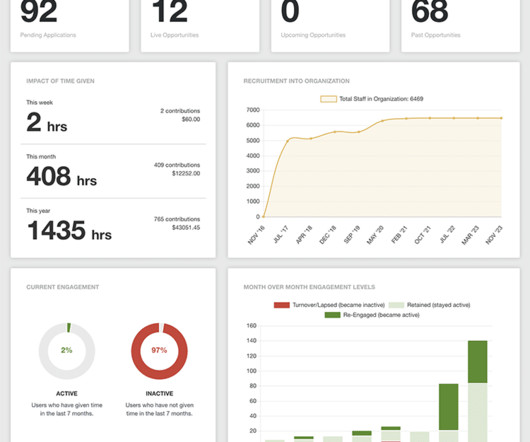
These capabilities show: Key Metrics in Volunteer Contribution Analysis The number of interactions based on how often volunteers showed up for work—a volunteer who helps over a period of time is more valuable than the volunteer who engages a single time. We’d love to hear from you! Login to your account.
delivers new capabilities that make data easier for everyone to use, including more efficient data prep and faster analysis. Edit and transform existing Metrics into dynamic KPIs with historical comparisons, constant comparison with status, and custom date ranges. Jumpstart your analysis. Jumpstart your analysis.
The Tableau Exchange is your one-stop-shop for offerings to jumpstart your data analysis to answer questions and get actionable data quickly. We’ve added Accelerators that help you dig into metrics like patient wait time, the seasonality of admission rates, and readmission rates, and more. Take our healthcare offerings, for example.
Finance professionals can provide key insights into risk analysis, financial forecasting, and performance measurement, ensuring each new revenue stream supports your long-term sustainability and growth. Create an action plan: Choose one area to explore, set up financial metrics, and implement the plan.
8: Your Organization Doesn’t Have KPIs and Metrics Challenge : Without key performance indicators (KPIs) or metrics, your organization is missing out on vital information about your members. Set up your KPI and metrics! If your KPIs and metrics aren’t set up properly, what you do pull could vary tremendously over time.
To better understand the shortcomings of for-profit metrics as a true measure of nonprofit success, lets look at how return on investment (ROI) is calculated. You will have the elements to translate between and marry the business metrics that ROI measured and your mission impact criteria.
Monitor metrics such as engagement rates, content reach, and donor response. Explore how the strategic integration of SWOT analysis, audience mapping, SMART communication targets, channel identification, content strategy, execution and evaluation, and high-level communications planning can shape a successful digital transformation.
Does the platform provide powerful tools for data analysis, insight and built-in reporting for nonprofit metrics? Does it have pre-built dashboards with nonprofit metrics that are important for each persona at your organization and important for board members. Is the technology popular in the market?
Brent Merritt is a digital strategy consultant at Metric Communications and blogger at The Caliper. This is absolutely critical because it allows you to set up the right kind of ad campaign, and it also lets Facebook report back on key metrics about your ads, including how many people are giving, and how much.
Provide a Benefit Analysis ROI in Focus: While emotional appeals are powerful, it’s also crucial to underscore the tangible benefits. By providing a clear benefit analysis, you’re showcasing how every dollar spent on analytics can yield real returns. These could be qualitative or specific metrics or KPIs.
Tableau is a leader in the analytics market, known for helping organizations see and understand their data, but we recognize that gaps still exist: while many of our joint customers already benefit from dbt and trust the metrics that result from these workflows, they are often disconnected and obscured from Tableau’s analytics layer.
Data analysis and data-driven decision-making have been part of the vocabulary in organizations over the years. And, while data analysis is one of the most in-demand tech skills sought by employers today, not everyone in an organization has “analyst” in their job title—myself included. What is Einstein Copilot for Tableau?
You can also have AI analyze recordings of past pitches to review metrics like listening ratio, speaker engagement, and overall emotional tone of the meeting. Adding the Human Touch to Reduce the Cringe We’d be remiss to not address how to avoid being creepy when using AI.
To facilitate this decision, DataRobot platform provides Challenger Insights, a deep but intuitive analysis of how well the Challenger performs and how it stacks up against the Champion. This also shows how the models compare on standard performance metrics and informative visualizations like Dual Lift.
This is critical for proper analysis and strategy refinement. You should segment your membership by the metrics that matter most to you, such as demographics, tenure, behavior, at-risk status, periods of time and more. Your association should create consistent values to accurately calculate your retention rate.
Once you’re sure that you have the targeting correct, move to the next point of the funnel for analysis. The donation page conversion rate The donation page conversation rate is the best metric to judge your email by as it represents the ultimate goal of a fundraising email—getting donations.
1) Data Analysis and Reporting Marketing automation platforms give aggregated insights into donor behavior and campaign performance. Open rates , click-through rates , conversion rates , and other metrics measure the effectiveness of your fundraising efforts. 2) A/B Testing Not sure what subject line to go with? Test both!
Going Beyond Basic Metrics Learning analytics goes beyond basic metrics to offer you a deeper understanding of course performance and learner engagement. Example: Through a learner sentiment analysis, one association discovered that one of their courses consistently received low ratings due to challenging content delivery.
By building this analysis into the decision-making process, organizations can make more informed choices about when and how to leverage AI responsibly. The key is to thoughtfully evaluate that footprint and weigh it against the potential benefits of deploying an AI solution. Is the impact significant enough to justify the emissions generated?
Sales Ops Metrics & KPIs. As the volume of business information exploded, sales ops has evolved into a more powerful data analysis and reporting unit that can provide critical insight on the following areas: Sales Process Optimization. Performance Metrics Analyses. Selection of Key Sales Metrics to Adopt.
Software giant Autodesk created Total Carbon Analysis for Architects, a digital tool that makes the evaluation of embodied and operational carbon far simpler and more intuitive than it had been for most designers. Gensler estimates that use of GPS has the power to offset up to 341,000 metric tons of carbon annually.
Google Analytics 4 (GA4) introduces a new approach to data analysis, providing enhanced features for explorations and reporting. Compare performance : Assess how metrics change over time. Proper use of the date range tool ensures your data analysis is timely, relevant, and actionable. weekly, monthly, quarterly).
If you are not sure which metrics are essential or how to convert your data into something stakeholders can grasp and absorb, start simply by setting clear goals. Data analysis tools are helping organizations of all sizes to automate, streamline, and standardize processes so they can measure and optimize performance.
Moreover, your objectives can also guide you in the analysis of your campaign’s performance. It’s a good idea to be strategic, with the use of a content plan to schedule the content of your #GivingTuesday campaign in advance and what metrics you’ll be measuring to determine whether your campaign was successful. 3) Plan your content.
Lead Executive : Provides operational leadership for initiatives, interfaces with the Oversight Group, ensures coordination, and monitors performance metrics. Project Leaders/Project Groups : Task groups composed of cross-functional subject matter experts focused on specific initiatives. This is not a thought exercise.
That massive, continuous flow of data generated by base stations, routers, switches and data centers including network traffic information, performance metrics, configuration and topology is unstructured and complex. Amdocs Network Assurance Agent, powered by amAIz Agents , automates repetitive tasks such as fault prediction.
It can be helpful to set up dashboards that give you a daily overview of key performance metrics and trends for each of your campaigns. Also, be sure to set up more detailed reports for deeper analysis. A good place to start is to think about the metrics that are most important to each campaign. Analyze during the campaign.
For associations offering courses and certifications, having basic metrics on things like participation counts and revenue are critical – but just the start. The Nucleus data analytics platform has two dedicated and ready-to-use packages for precisely these types of analysis: Learning Management and Certifications.
AARPs data set presented an interesting information design challenge: the numbers and percentages for the various metrics didnt use a consistent scale. A high number on one metric could mean poor performance. A high number on another metric, however, could be cause for celebration. Is that number good?
Artificial intelligence works through machine learning, which involves the discovery and analysis of deep patterns in datasets. These algorithms are continually refined over time as more data is generated for analysis. The most user-friendly AI tools will provide these insights in the form of predictive scores and rank metrics.
release includes features that speed up and streamline your data preparation and analysis. Select which dimensions and measures to focus the analysis on, and choose the desired story type. The augmented experience generates automated narratives in seconds, replacing manual reporting and speeding up analysis. Bronwen Boyd.
release includes features that speed up and streamline your data preparation and analysis. Select which dimensions and measures to focus the analysis on, and choose the desired story type. The augmented experience generates automated narratives in seconds, replacing manual reporting and speeding up analysis. Bronwen Boyd.
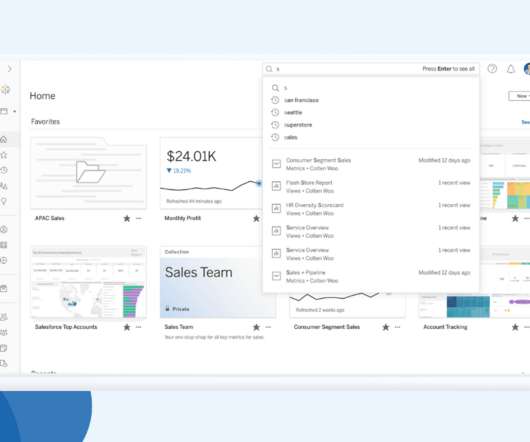
Plus, we’ve made improvements to Metrics , Tableau Mobile , and more! Get a jump-start on your analysis with Tableau Accelerators, now part of the Tableau Exchange. Today, you’ll find more than 70 new industry-specific Accelerators to give you a valuable starting point for your analysis. Get more value from your Metrics.
Plus, we’ve made improvements to Metrics , Tableau Mobile , and more! Get a jump-start on your analysis with Tableau Accelerators, now part of the Tableau Exchange. Today, you’ll find more than 70 new industry-specific Accelerators to give you a valuable starting point for your analysis. Get more value from your Metrics.
We organize all of the trending information in your field so you don't have to. Join 12,000+ users and stay up to date on the latest articles your peers are reading.
You know about us, now we want to get to know you!
Let's personalize your content
Let's get even more personalized
We recognize your account from another site in our network, please click 'Send Email' below to continue with verifying your account and setting a password.


Let's personalize your content