Remove Analysis Remove Comparison Remove Taxonomy
article thumbnail

A crash course on trends analysis using Candid’s Foundation 1000 data set 

Candid

In comparison, our Foundation 1000 data set is limited to grants of $10,000 or more awarded by a set of 1,000 of the largest U.S. Why we use the Foundation 1000 sets for trends analysis As illustrated in the chart above, the Foundation 1000s’ grantmaking is much more stable over time compared to the broader grant data set.

Analysis 116
article thumbnail

Who is sharing nonprofit demographic data with Candid? 

Candid

Here we share four key insights from our recent analysis of Candid’s nonprofit demographic data and what they mean for the nonprofit sector today. Analysis is limited to 501(c)(3) public charities that filed at least one Form 900 or Form 990-EZ between 2017-2021 and had at least $50,000 in annual expenses. Source: Candid, 2023.

professionals

Sign Up for our Newsletter

This site is protected by reCAPTCHA and the Google Privacy Policy and Terms of Service apply.

article thumbnail

Mapping funding for racial justice: A political imperative

Candid

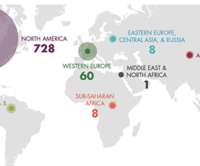
Our analysis provides an evidence base to understand and strengthen resourcing for social change. We are changing our analysis and shifting our practices to be fully accountable to racial justice movements. Looking across years and areas illuminates trends, uncovers gaps, and provides comparisons within the field.

Map 98
article thumbnail

Shoulder-to-Shoulder Instructional Media: My Tagging Screencast at NTEN!

Beth's Blog: How Nonprofits Can Use Social Media

If you want a detailed comparison of these and other social bookmarking services, you can read one at Consultant Commons. A few nonprofits are using socialbookmarking to track resources or follow particular topics for trend analysis for strategic planning. re not creating a formal taxonomy, rather it???s tag as private???