Remove Analysis Remove Chart Remove Picture
article thumbnail

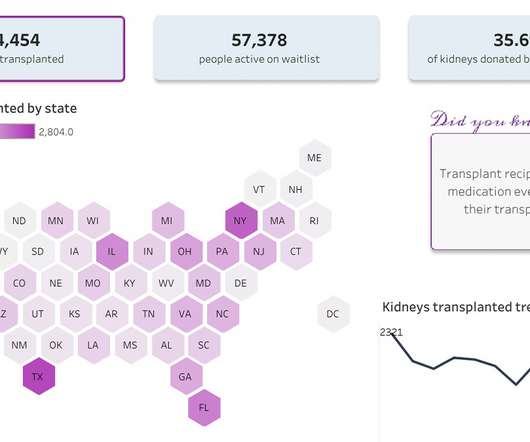
Beyond the Pie Chart: Maps

Tech Soup

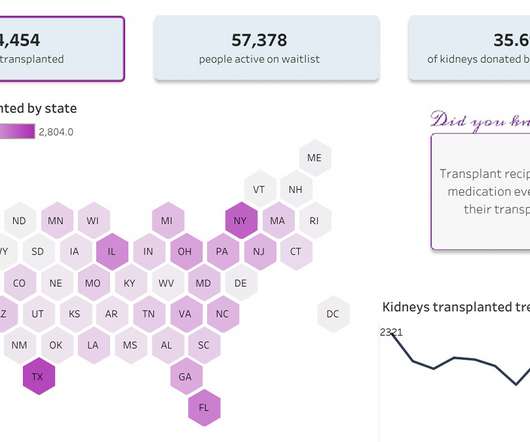
Charts and graphs are useful, but when you have any kind of location data — whether it's postal codes, state abbreviations, country names, or your own custom geocoding — you've got to see your data on a map. Part 4 in our Beyond the Pie Chart series covers mapping. So demand the same informative view from your data.

Chart 36
article thumbnail

Have grantmaker salaries kept up with inflation?  

Candid

The Council on Foundations’ 2023 Grantmaker Salary and Benefits Report Key Findings (for which Candid provided data analysis) offer a broad picture: Median full-time staff salaries for select roles rose 5.49% between 2022 and 2023, i as reported by a non-representative panel of 514 grantmaking organizations.

Rate 106
professionals

Sign Up for our Newsletter

This site is protected by reCAPTCHA and the Google Privacy Policy and Terms of Service apply.

article thumbnail

Pop the champagne: This year Candid’s grants data set turns 21!

Candid

Much like a developing human, our data collections have gotten bigger over time (see chart below), undergone developmental changes, and experienced the associated growing pains. Analysis tip : We still create these annual data sets. And this year, it enters full-fledged adulthood! government agencies ii.

Grant 98
article thumbnail

Nonprofits and Libraries: It's Time to Move Beyond the Pie Chart

Tech Soup

That's why TechSoup has partnered with Tableau on a new blog series called "Beyond the Pie Chart." Tried to create a report and couldn't find a chart or graph that would clearly illustrate your point? Picture a spreadsheet with a long list of individual donations. Why You Need to Move Beyond the Pie Chart.

Chart 36
article thumbnail

Data as Decision in Grantmaking

sgEngage

Datamaking can enhance capacity building efforts through group questioning and analysis. We are taught to create an organizational chart or a program activity graphic or a network diagram of organizations needed to address an issue like homelessness or educational equity. These are opportunities for meaning making.

Data 105
article thumbnail

Building Successful Relationships With Major Donors: 4 Tips

Greater Giving

According to a Chronicle of Philanthropy analysis , wealthy donors gave nearly $300 million more to nonprofits in the first five months of 2024 than they did over the same period last year. Make your reports more engaging with videos, photos, and interactive infographics, such as maps or charts showing changes over time.
article thumbnail

Which Social Networking Analysis Term Best Describes Virgin America?

Beth's Blog: How Nonprofits Can Use Social Media

This is a post to help me identify what I don't know about social network analysis and mapping tools with the hope that you'll fill in the gaps in the comments. How would you describe Virgin America in social networking analysis and mapping terminology? . I flew back from DC last night on Virgin America. Source: Monitor Institute.