This site uses cookies to improve your experience. To help us insure we adhere to various privacy regulations, please select your country/region of residence. If you do not select a country, we will assume you are from the United States. Select your Cookie Settings or view our Privacy Policy and Terms of Use.
Cookie Settings
Cookies and similar technologies are used on this website for proper function of the website, for tracking performance analytics and for marketing purposes. We and some of our third-party providers may use cookie data for various purposes. Please review the cookie settings below and choose your preference.
Used for the proper function of the website
Used for monitoring website traffic and interactions
Cookie Settings
Cookies and similar technologies are used on this website for proper function of the website, for tracking performance analytics and for marketing purposes. We and some of our third-party providers may use cookie data for various purposes. Please review the cookie settings below and choose your preference.
Strictly Necessary: Used for the proper function of the website
Performance/Analytics: Used for monitoring website traffic and interactions
The maître d’ has called your name, the table is set, and the napkins are folded up like fancy little swans: it’s time to dig in to a year’s worth of M+R Benchmarkscharts, findings, and insights at mrbenchmarks.com ! yes) The full feast of data and analysis is waiting for you at mrbenchmarks.com. The post Come and get it!
Pack your bags, lock your tray table, and fasten your seatbelt: the 2022 M+R Benchmarks Study is ready for takeoff. Go explore the findings, charts, and analysis at mrbenchmarks.com. . The complete data and analysis are available to explore for free at mrbenchmarks.com.
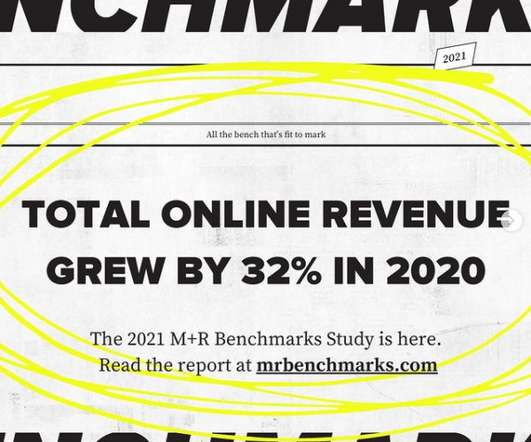
We are excited to report that the 2021 M+R Benchmarks Study is ready for you. Go explore the findings, charts, and analysis at mrbenchmarks.com. . You will find surprises, inspiration, and a wealth of information in the full Benchmarks Study. Related Links: Google Analytics and Benchmarks: What you need to know.
The latest edition of the annual M+R Benchmarks Study has arrived, and here’s your ticket to ride. Visit mrbenchmarks.com now to explore all the charts, analysis, insights, and more! About half of M+R Benchmarks participants reported working with social media influencers in 2023. The 2024 M+R Benchmarks Study is here!
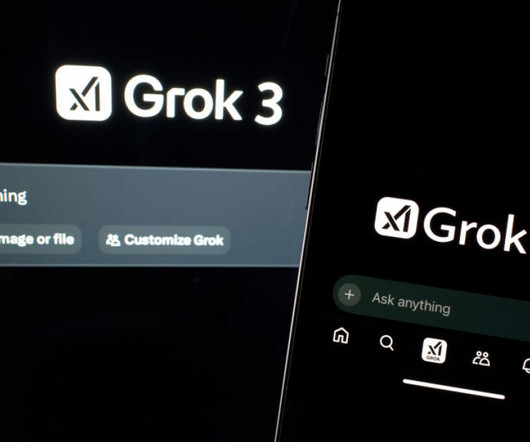
xAI is promoting Grok 3 as the best model on the market, claiming it surpassed competitors from OpenAI , Google , Anthropic, and DeepSeek on key benchmarks. Shortly after the benchmarks were shared on the livestream, OpenAI product engineer Rex Asabor posted an "updated" chart with o3 beating Grok 3 Reasoning in math and science benchmarks.
Spitfire’s useful SMART chart planning tool has been used by many nonprofits and was adapted for social media for nonprofits by NTEN’s WeAreMedia project several years ago. It also helps to break down your goal into monthly or quarterly benchmarks. What is your organization’s SMART social media objectives?
According to OpenView’s annual Financial & Operating Benchmarks report , only 13% of nearly 600 companies surveyed named “burning too much cash” as one of their top three concerns, compared to 30% last year. And which benchmarks can they use to evaluate their performance? Just look at this chart:
This panel will discuss realistic metrics and benchmarks any organization can use in their campaigns and ensure that your using the right strategies and tools to listen and engage your audiences on different social networks. Over those 80 years, the chart has been polished, refined and so deeply embedded in business thinking.
These are the practice indicators for measurement – for three different areas – analysis, tools, and sense-making. I’ve also used this as benchmark for my training and peer learning projects so one could quantify transformation. Click to See Larger Version.
Start with benchmark data. Luckily, there are a number of great reports available to help you set a benchmark against industry averages. These are some places to begin: M+R Benchmarks ; Fundraising Effectiveness Project Reports ; Fundraising Report Card Benchmarks. . . — Kevin Shulman for the Agitator-DonorVoice.
2008 donorCentrics Internet Giving Collaborative BenchmarkingAnalysis); * The average online gift was $144.72, according to BlackBaud though M&R’s benchmark study noted that the average one time online gift was $81. How Does Your Nonprofit Measure Up? Tell people what you want them to do quickly.
Delight: Check out these charts and graphs! Elearning space defines it as: “Use of intelligent data, learner-produced data, and analysis models to discover information and social connections, and to predict and advise on learning.” Denial: You can’t measure social media! I tested each one.
Since Tableau's first release in 2004, all visualizations created inside Worksheets have been rendered using VizQL , a breakthrough technology that allows you to create a chart with a simple drag-and-drop. Shipping sankey chart by Tristan Guillevin. Say hello to complex charts, as easy as drag and drop. What are Viz Extensions?
While not a representative sample of institutional funders, it’s one of best avenues for detailed exploration and benchmarking of salaries. Analysis set of grantmakers’ full-time CEO salaries Min 25th percentile Median Mean 75th percentile Max No. In 2022, 1,003 grantmakers participated in the survey.
Step 4: Define your benchmarks. ” KPIs are simply data points for charting progress towards results. I use the chart below, which comes from Chapter 5 of our book. They also look at qualitative data, including doing a content analysis of their member feedback. Step 3: Define your investments.
” TechSoup’s Coleridge likens analytics to a roadmap that guides where an organization wants to go with benchmarks that mark the progression to a goal. Tools that incorporate a dashboard can help organizations visualize and more easily analyze their data by taking that information and turning it into charts and graphs.
The survey looked at nonprofit’s self-reported results, goals, time investment, and measurement approaches for Facebook, although I wonder if you can really answer the big picture question without looking at how nonprofits use Facebook in the context of an integrated strategy and good measurement practice benchmarking study.
In this post, you’ll learn from my mistakes and create better charts for your audience – to show fundraising results, organization’s impact or benchmarking. Have you seen a chart and asked yourself, “What is this? Are we guilty of creating such charts ourselves? Different shapes or chart types have their uses.
In addition to these insights, the report provides information to help nonprofits benchmark compensation to ensure competitive salaries for their employees. The chart below shows that median compensation for these executive positions has gradually increased between 2018 and 2022.
Spitfire’s useful SMART chart planning tool has been used by many nonprofits and was adapted for social media for nonprofits by NTEN’s WeAreMedia project several years ago. Benchmarking comparing your organization’s past performance to itself or doing a formal or informal analysis of peer organizations can help.
You need a detailed analysis to make an actionable plan to improve your fundraising efforts. Luckily, you can achieve a thorough analysis with these 10 key data points from either your CRM or accounting software. However, much can be learned from analyzing even a single year and comparing yourself to industry benchmarks.
Data analysis dos and don’ts Don’t expect a one-size-fits-all answer. Do use Candid’s demographic data for research and analysis. In addition, Candid’s recently released benchmarking report, The state of diversity in the U.S. Approach the data as an opportunity to understand grantee and overall portfolio trends.
Benchmarks let us know how we perform compared to our event fundraising peers. Metrics and benchmarks can be our guides to whether your efforts at creating a great experience for participants are paying off. Just getting started using metrics and benchmarks to improve performance? Number of participants. Set your own baseline.
Definition: An analysis that looks at the benefits, costs, and value of a technology project over time. It is a flow chart that calculates business performance taking into account not only whether the company had a profit, but whether that profit was good enough relative to the assets it took to generate it. Task Analysis.
Well, that's an awful lot of pages of data and words, and you want some quick-fix guidelines and benchmarks. Based on years of biannual report analysis, I find that annual budget, mission focus, and service area, in that order, have the most impact on an organization's grantseeking experience. So Now What? Mission Focus.
Forum One was a sponsor, and several of my colleagues from our user experience and design team lead sessions on topics ranging from tips on quick and simple audience analysis to learning from design mistakes and making client engagement fun in a group setting. It reminded me of one of my favorite designs -- for the U.S.
In this case, you can test to see which ad scores higher on your charts, and begin testing variants against this ad. Today, there are a host of services that offer not only A/B testing and fine tuning for websites, but a number of other valuable services (heat mapping, evaluation forms, benchmarking studies, etc.). Conduct interviews.
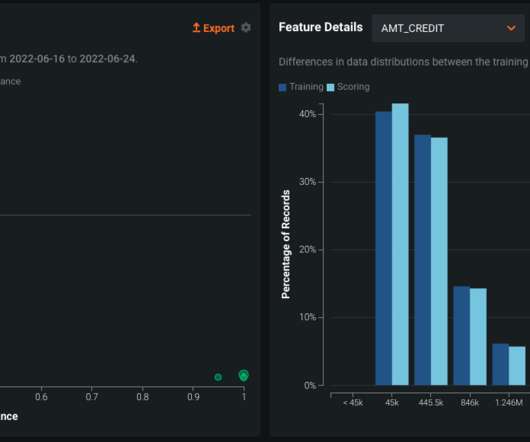
In the image below, we see two charts depicting the amount of drift that has occurred for a deployed model. On the left-hand side, we have a chart that depicts a scatter plot of the feature importance of a model input against drift. Model Benchmarking. The importance of benchmarking in a sound MRM process can not be understated.
I just finished reading the 2008 donorCentrics Internet Giving BenchmarksAnalysis , put out by Blackbaud company Target Analytics. Get the report and read it. It points to some great momentum in online giving.
About a year ago, I decided to benchmark my blog using some tips suggested by Avinash Kaushik. Kaushik suggested these metrics for benchmarking blogs: Raw Author Contribution (posts & words in post). Calculating benchmarks should not take you more time than it is worth. You can do an analysis of your blog feed here.
You ascertain averages, browse benchmarks , and create charts. You are using diagnostic analytics if you have dashboards or established benchmarks for your campaigns. This type of analysis has served us fairly well to date. If you’re like most peer-to-peer fundraising (P2P) staff, you’re drowning in data.
Enhanced Interactive Event Features Incorporate interactive elements such as seating charts, goal meters, and live chats to create an engaging virtual environment. Tools and Methods for Effective Campaign Analysis Employ analytics tools that provide comprehensive reports on various aspects of your campaign.
Promises include: Tuva wants to become the open standard for healthcare data transformation and build the data network for multisite benchmarking and research. Promises include: Toolchest says it will make it possible for drug discovery companies to get analysis results up to 100 times faster.
Designs and launches new initiatives, drives organizational strategy, and helps chart the future of Feeding America. Currently serves on various funding and advisory boards, including World Benchmarking Alliance, and has recently been elected president of the American Evaluation Association for 2022 . Ami McReynolds. Feeding America.
We organize all of the trending information in your field so you don't have to. Join 12,000+ users and stay up to date on the latest articles your peers are reading.
You know about us, now we want to get to know you!
Let's personalize your content
Let's get even more personalized
We recognize your account from another site in our network, please click 'Send Email' below to continue with verifying your account and setting a password.


Let's personalize your content