Remove Analysis Remove Benchmark Remove Benefit Remove Comparison
article thumbnail

NTEN and TechSoup Webinar: Share Your Story - ROI and Social Media - Slides and Notes

Beth's Blog: How Nonprofits Can Use Social Media

Definition: An analysis that looks at the benefits, costs, and value of a technology project over time. Clearly articulated benefits statement that looks at tangible and intangible. Financial calculations: net gain, opportunity cost, or comparison to other method. There are two types of benefits. Tangible Benefits.

ROI 50
article thumbnail

Mapping funding for racial justice: A political imperative

Candid

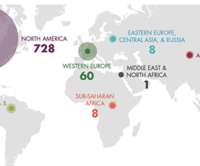
Our analysis provides an evidence base to understand and strengthen resourcing for social change. We are changing our analysis and shifting our practices to be fully accountable to racial justice movements. Looking across years and areas illuminates trends, uncovers gaps, and provides comparisons within the field.

Map 94
professionals

Sign Up for our Newsletter

This site is protected by reCAPTCHA and the Google Privacy Policy and Terms of Service apply.

article thumbnail

What do web stats mean, anyway?

Zen and the Art of Nonprofit Technology

to care a whole lot about how many hits they got in comparison to similar (or different) organizations. The same people that want all your site stats made public probably want to know the salaries and benefit packages of the employees too, and they aren’t entitled to that either. And, I actually hope that doesn’t change.

Stats 100
article thumbnail

Key Findings from the 2020 donorCentrics® Sustainer Summit

Connection Cafe

Benchmarking d ata, drawn directly from participant CRMs and standardized to allow for consistent comparisons, included 16 million donors who gave 56 million gifts for a total of $2.3 The analysis is based on a July – June fiscal year, covering the period of FY2015 through FY2019. .

article thumbnail

Trends in Sustainer Giving – Key Findings from the 2019 donorCentrics Sustainer Summit

Connection Cafe

This year’s summit included 35 large nonprofit organizations that participate in our sustainer program benchmarking to review aggregate program performance, trends and challenges affecting sustainer giving. Data, drawn directly from participant CRMs and standardized to allow for consistent comparisons, included 17.7 billion in FY2018.

Trend 30
article thumbnail

Key Findings from the 2021 donorCentrics® Sustainer Summit

sgEngage

This year’s summit included data from a variety of sectors, drawn directly from participant CRMs and standardized to allow for consistent comparisons. The analysis is based on a July – June fiscal year, covering the period of FY2016 through FY2020. The data set included 16 million donors who gave 57 million gifts for a total of $2.4

article thumbnail

A Fundraiser’s Secret Weapon: Data Analytics

Connection Cafe

Data—the capture, analysis, and use—can be overwhelming. The analysis of our fundraising programs’ performance helped set the foundation for embracing big data and creating the cultural shift needed at Project HOPE. The analysis moved beyond short-term metrics such as annual net revenue and took a macro view of our program.