This site uses cookies to improve your experience. To help us insure we adhere to various privacy regulations, please select your country/region of residence. If you do not select a country, we will assume you are from the United States. Select your Cookie Settings or view our Privacy Policy and Terms of Use.
Cookie Settings
Cookies and similar technologies are used on this website for proper function of the website, for tracking performance analytics and for marketing purposes. We and some of our third-party providers may use cookie data for various purposes. Please review the cookie settings below and choose your preference.
Used for the proper function of the website
Used for monitoring website traffic and interactions
Cookie Settings
Cookies and similar technologies are used on this website for proper function of the website, for tracking performance analytics and for marketing purposes. We and some of our third-party providers may use cookie data for various purposes. Please review the cookie settings below and choose your preference.
Strictly Necessary: Used for the proper function of the website
Performance/Analytics: Used for monitoring website traffic and interactions
Set Clear, Measurable Goals: Define success metrics that are specific, actionable, and adaptable as your association grows and evolves. Identify Skill Gaps: Determine where training is needed, particularly in digital literacy and data analysis, to equip your team for success.
Set Clear Goals and Metrics : Define what success looks like in terms of member engagement, satisfaction, and retention. Track these metrics over time to adjust your strategy as needed. Implement Data Analytics : Leverage data analytics to track member behavior, event participation, and other key metrics.
Measuring Training Effectiveness with LMS Analytics Gyrus Systems Gyrus Systems - Best Online Learning Management Systems Introduction Companies use Learning Analytics Tools to collect, analyze, and measure the effectiveness of their learning and development programs. It helps them know if they are using time and resources wisely.
Well, from the planning and analysis side, that is. DIY Community Engagement Metrics. Metrics Tracking. >> Remember – Even if you’re using google alerts and google analytics, you may not really be able to look at data over time in a critical way. Presentation. View more presentations from Amy Sample Ward.
Especially in associations, analytics can provide invaluable insights, guiding strategies and shaping outcomes. However, the hurdle remains: how do you convince the powers-that-be to earmark a slice of the budget for analytics? By using analytics, they realize that most of their online course engagement happens in the evenings.
By harnessing the power of learning analytics, decision-makers can gain valuable insights into learner behavior, course effectiveness, and overall program success. Let’s dive into how learning analytics can drive engagement, improve course completion rates, identify gaps in learning programs, and optimize the learning experience.
Those traditional metrics are a good starting point, but often do not tell the whole story. Data can help you think more broadly to identify a valuable product based on your specific goals and success metrics. Understanding post-purchase behavior is an important part of the analysis. What is the trend in sales over time?
With a modern ecosystem, your association can start by separating out analytical data from transactional data. 8: Your Organization Doesn’t Have KPIs and Metrics Challenge : Without key performance indicators (KPIs) or metrics, your organization is missing out on vital information about your members. Set up your KPI and metrics!
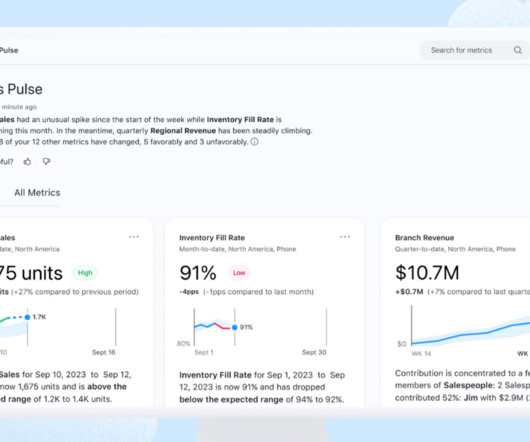
That’s why it’s never been more essential for companies to create a comprehensive analytics strategy and become data-driven. Tableau Pulse In the past, proficiency in data and analytics required specific skill sets. Your personalized Tableau Pulse homepage displays a summary of the key metrics that you follow.
The Tableau Exchange is your one-stop-shop for offerings to jumpstart your data analysis to answer questions and get actionable data quickly. We’ve added Accelerators that help you dig into metrics like patient wait time, the seasonality of admission rates, and readmission rates, and more. Take our healthcare offerings, for example.
And yet SMART goals are so crucial in data analysis because they provide direction needed for inquiry. For example, knowing that you want to increase a specific type of membership can make all the difference in measurement, analysis, and strategy. What metrics could you use to predict whether you will achieve your goals ?
Google Analytics 4 (GA4) introduces a new approach to data analysis, providing enhanced features for explorations and reporting. This guide will walk you through using the date range tool in GA4’s explorations and reporting functionalities, ensuring you can harness the full potential of your analytics data.
I found this wonderful infographic that takes you through the process of setting goals, making them measurable, picking your metrics, and making decisions based on your data. Facebook analytics programs like Insights , Edgerank Checker , and Simply Measured free reports give you tons of data points. I only look at these: Reach.
Jobs requiring digital skills, particularly data analytics and visualization, will grow by 10% in the next five years, jumping from 27% to 37%, according to a new IDC Salesforce Economy study. IDC research shows that only 33% of employees are comfortable using data analytics to support their decisions. Product Marketing Manager.
Once the hallmark of marketing professionals and financial analysts, data analysis has now infiltrated almost all aspects of our life from fitness trackers (got to make sure you get those steps in!) Data analytics for nonprofits is just as valuable … and even more crucial. Fundraising Metrics. Social Media Metrics.
The Tableau Exchange is your one-stop-shop for offerings to jumpstart your data analysis to answer questions and get actionable data quickly. We’ve added Accelerators that help you dig into metrics like patient wait time, the seasonality of admission rates, and readmission rates, and more. Take our healthcare offerings, for example.
Mastering an analytic approach to strategy and planning. Master an analytic approach to strategy and planning. That’s why you need an analytic, numbers-based perspective to strategy and planning. Here are some of the questions you might ask in order to understand what metrics to track: . Let’s say you’re a food bank.
This is critical for proper analysis and strategy refinement. You should segment your membership by the metrics that matter most to you, such as demographics, tenure, behavior, at-risk status, periods of time and more. Association Analytics can help you gain the insights you need to increase your member retention.
Tableau is a leader in the analytics market, known for helping organizations see and understand their data, but we recognize that gaps still exist: while many of our joint customers already benefit from dbt and trust the metrics that result from these workflows, they are often disconnected and obscured from Tableau’s analytics layer.
Jobs requiring digital skills, particularly data analytics and visualization, will grow by 10% in the next five years, jumping from 27% to 37%, according to a new IDC Salesforce Economy study. IDC research shows that only 33% of employees are comfortable using data analytics to support their decisions. Product Marketing Manager.
According to Louise Craft, digital marketing executive at Metric Mogul, Analytics “ensures marketers can make data led decisions to streamline their marketing efforts, increase their conversion rates and ultimately achieve their business goals.” do not have e-commerce tracking set up in their Google Analytics accounts.
If your organization is struggling to find the right analytic tools to track your website traffic, social media presence, and how your reports, campaigns, or infographics perform across the web, check out this list of 5 helpful analytic tools. Google Analytics Report with Visually. Google Analytics Report with Visually.
Step 1: Ensure Proper GA4 Installation GA4 is Google’s newest iteration of the Google Analytics platform. Curious how GA4 differs from the old Universal Analytics, check out Whole Whale’s article comparing the two platforms. NOTE: GA4 dimensions are scoped differently based on the metrics you want to look at.
Does the platform provide powerful tools for data analysis, insight and built-in reporting for nonprofit metrics? Does it have pre-built dashboards with nonprofit metrics that are important for each persona at your organization and important for board members. 5) Outcomes and Analytics. Outcomes matter.
A recent Analytics in Action webinar, titled Embracing Data Analytics to Reinvent Your Content Marketing , delved into just this. Data Integration: Ensure your data is collected, integrated, and optimized for analysis. AI-Powered Content Creation: Use AI tools to craft personalized messages for each segment.
We have a couple of points of note around the transition from Google Analytics 4 (GA4) to Universal Analytics (UA) and how that impacted the website data in Benchmarks this year, but first, for fun, an action item! Analytics are a critical tool for digital markers, so what’s changed with tracking from GA4 to UA? We’ll wait.
This is the final post in a three-part series about transformational analytics for the enterprise. In case you missed them, read the first on governance and data management that enables your digital business , and the second on modern analytics for fast decision-making. Adopt an agile approach to managing your analytics environment.
Monitor metrics such as engagement rates, content reach, and donor response. Explore how the strategic integration of SWOT analysis, audience mapping, SMART communication targets, channel identification, content strategy, execution and evaluation, and high-level communications planning can shape a successful digital transformation.
That’s why it’s never been more essential for companies to create a comprehensive analytics strategy and become data-driven. Tableau Pulse In the past, proficiency in data and analytics required specific skill sets. Your personalized Tableau Pulse homepage displays a summary of the key metrics that you follow.
This is the final post in a three-part series about transformational analytics for the enterprise. In case you missed them, read the first on governance and data management that enables your digital business , and the second on modern analytics for fast decision-making. Support employees in growing their analytics skills.
This week, Gartner published the 2021 Magic Quadrant for Analytics and Business Intelligence Platforms. In every release, we're making Tableau easier to use, more powerful, and simpler to deploy to support governed data and analytics at scale. Read the 2021 report for Gartner analysis. Francois Ajenstat. Kristin Adderson.
The thing that is prompting this post is the little storm about the security metric that we used to try and get a handle on the security of the 4 different systems we reviewed. First, a simple metric relating to security reports, and second, what processes are in place in the communities to deal with security. More on that in a bit.
Just as you’ve finally settled into the shift from Universal Analytics (UA) to Google Analytics 4 (GA4) and started to get a handle on its new metrics, Google has yet another deadline for organizations to meet. On July 1, 2024, Google will permanently remove access to all Universal Analytics data.
Digital Information World: Analysis summarizing Imperva data on bot traffic and industry breakdowns ( Digital Information World ) We’ve Been Here Before (Sort Of) Remember when mobile overtook desktop? Traditional metrics like pageviews and session duration are increasingly influenced by bot behavior.
For associations offering courses and certifications, having basic metrics on things like participation counts and revenue are critical – but just the start. The Nucleus data analytics platform has two dedicated and ready-to-use packages for precisely these types of analysis: Learning Management and Certifications.
Measurement tools or perhaps more accurately, social analytics tools collect that data. Social media metrics mavens know that both qualitative and quantitative data is needed. If you are measuring reach, engagement or action, you’ll need an analytics tool. Content Analysis Tools: Radian 6 and Netvibes.
To measure the return on investment – or ROI – of your SEO campaigns, utilize the information aggregated from Positionly and Google Analytics to pull through the data and analyze patterns in traffic, increases in links, sustainable traffic and above all, increases in revenue. Rising non-branded organic traffic. Increased inbound links.
Data analysis and data-driven decision-making have been part of the vocabulary in organizations over the years. And, while data analysis is one of the most in-demand tech skills sought by employers today, not everyone in an organization has “analyst” in their job title—myself included. What is Einstein Copilot for Tableau?
Kristin Adderson June 11, 2024 - 4:53pm Noel Carter Senior Product Marketing Manager, Tableau Evan Slotnick Product Management Director, Tableau At the Tableau Conference 2024 keynote , Tableau CEO Ryan Aytay spoke about the new wave of analytics: the consumerization of data. However, every new opportunity brings its challenges.
Sales Ops Metrics & KPIs. As the volume of business information exploded, sales ops has evolved into a more powerful data analysis and reporting unit that can provide critical insight on the following areas: Sales Process Optimization. Performance Metrics Analyses. Selection of Key Sales Metrics to Adopt. Automation.
Growth hackers utilize analytical thinking, product engineering and creativity to significantly increase their company’s core metric(s). Anyone who figured out how to game Google’s algorithm (aka SEO) was leveraging both creativity and analytics to rapidly grow their company. Entrepreneur Insider Analysis and Opinion'
Tableau has been named a Leader in the Gartner Magic Quadrant for Analytics & Business Intelligence Platforms for the 10th consecutive year. Introduced Slack-first analytics to put data in the flow of work —and at the center of every conversation. Empower everyone with analytics. Put analytics in the flow of work.
Tableau has been named a Leader in the Gartner Magic Quadrant for Analytics & Business Intelligence Platforms for the 10th consecutive year. Introduced Slack-first analytics to put data in the flow of work —and at the center of every conversation. Empower everyone with analytics. Put analytics in the flow of work.
Measuring Training Effectiveness with LMS Analytics GyrusAim LMS GyrusAim LMS - Companies use Learning Analytics Tools to collect, analyze, and measure the effectiveness of their learning and development programs. Having measurable metrics is crucial to pinpoint what is and isn’t working in training development programs.
We organize all of the trending information in your field so you don't have to. Join 12,000+ users and stay up to date on the latest articles your peers are reading.
You know about us, now we want to get to know you!
Let's personalize your content
Let's get even more personalized
We recognize your account from another site in our network, please click 'Send Email' below to continue with verifying your account and setting a password.


Let's personalize your content