This site uses cookies to improve your experience. To help us insure we adhere to various privacy regulations, please select your country/region of residence. If you do not select a country, we will assume you are from the United States. Select your Cookie Settings or view our Privacy Policy and Terms of Use.
Cookie Settings
Cookies and similar technologies are used on this website for proper function of the website, for tracking performance analytics and for marketing purposes. We and some of our third-party providers may use cookie data for various purposes. Please review the cookie settings below and choose your preference.
Used for the proper function of the website
Used for monitoring website traffic and interactions
Cookie Settings
Cookies and similar technologies are used on this website for proper function of the website, for tracking performance analytics and for marketing purposes. We and some of our third-party providers may use cookie data for various purposes. Please review the cookie settings below and choose your preference.
Strictly Necessary: Used for the proper function of the website
Performance/Analytics: Used for monitoring website traffic and interactions
Content Map. Why create a content map? Supports tracking and analysis for message and call to action response. Google Analytics. Use this step-by-step guide for adding RSS feeds. Refer to the slides below for examples. Supports cross-team collaboration as staff understand where their content is going. Small Act’s Thrive.
One of the topics was “How to understand social networks through social network analysis and mapping techniques.&# I thought I’d expand on it here. As you can see there are many different ways to apply social networking analysis to understanding networks. When you map your network, it tells you a story.
2009 - Connected Action - Marc Smith - Social Media Network Analysis View more presentations from Marc Smith. In our book, The Networked Nonprofit , co-authored with Allison Fine, we provide an overview of mapping your social network in Twitter and other sites using some of the social network analysis tools available. .
release comes fully-loaded with tons of great features, including several key updates to boost your geospatial analysis. In particular, the new multiple marks layers feature lets you add an unlimited number of layers to the map. Drag and drop map layers—yes, it’s just that easy. The Tableau 2020.4 Getting started is easy!
Mapping these location elements allows for visualization, exploration, and communication about the spatial patterns in the data—helping us to better understand the world around us. . Map views, from left to right: value for a specific location (tooltip), explore regional patterns, and compare two maps.
Explore how the strategic integration of SWOT analysis, audience mapping, SMART communication targets, channel identification, content strategy, execution and evaluation, and high-level communications planning can shape a successful digital transformation. With ChatGPT’s analytical prowess, the process can be augmented.
Efficient geospatial manipulations for OSM map data Photo by Tabea Schimpf on Unsplash If you’ve worked with OSM data before, you know it’s not the easiest to extract. In fact, if you wanted, you could download the entirety of Open Street Maps data into one file, known as Planet (around 1000 Gb of data)! ?? Thanks for reading!
So, was delighted when Darren Barefoot asked if he share a guest post about how to do audience analysis. Cheap and Cheerful Audience Analysis for NGOS by Darren Barefoot. But not all kinds of audience analysis are evil. Create a heat-map to show them where they live, or a series of charts to breakdown their values.
Note: The purpose of this document is to both outline new Google Analytics 4 (GA4) functionality and develop a set of M+R recommendations. Analytics are an essential tool for digital marketers and there’s a big shift underway as Google Analytics 4 (GA4) is being implemented. Universal Analytics (a.k.a. Recommended Events.
Well, from the planning and analysis side, that is. We covered how to do Community Mapping (identifying the segments and goals of the community), Content Mapping (creating a plan for which content goes where, and why), and Data Tracking (pulling all the numbers together). Community Mapping. >> Content Mapping. >>
brings practical enhancements to make analytics in your organization more seamless and scalable. Enjoy multiple enhancements to bring your geospatial analysis to the next level, including multiple marks layers support for maps , Redshift spatial support, and more. Product Marketing Specialist, Tableau. Spencer Czapiewski.
Audience Analysis. You have a site map that resonates with the way your audience accesses information. Then, you can use Google Analytics to start understanding trends – how long are users spending on your website? One that every nonprofits should think about from time to time. View the Session Recording | Download the Slides.
Spatial analysis platform Carto has raised a $61 million Series C round. Carto lets you display that data on interactive maps so that you can more easily compare, optimize, balance and take decisions. This is where Carto comes along with a product specialized on spatial analytics. Insight Partners is leading today’s round.
This years list of biotech companies reflects the evolving impact of AI, a growing interest in cutting-edge research tools for single-cell analysis and spatial proteomics, and clinical advances for novel drug candidates that promise more convenient and effective treatment for conditions impacting millions of Americans.
This week, Gartner published the 2021 Magic Quadrant for Analytics and Business Intelligence Platforms. In every release, we're making Tableau easier to use, more powerful, and simpler to deploy to support governed data and analytics at scale. Read the 2021 report for Gartner analysis. Francois Ajenstat. Kristin Adderson.
Google Analytics – [link]. Whether you have a blog, website, or even multiple, you can use Google Analytics to really drill down into the data and understand how people are visiting and using your site. Tip: You can also get Google Analytics for your Facebook Page! These analytics are part of having a Facebook Page.
Participation primarily involves collecting and coding a big stack of data, which our analytics team will combine (anonymously!) In addition to helping make the study, you’ll receive an individualized analysis comparing the data you submitted for your organization to other organizations of your size and type.
We were all there thanks to the efforts of Drew Conway, Jake Porway, and Craig Barowsky (Data without Borders’s founders) who had the crazy idea of bringing together well-intentioned data analysts and non-profits with data in need of analysis. We were not able to make much significant progress on this second goal in a mere 48 hours.
Mapping these location elements allows for visualization, exploration, and communication about the spatial patterns in the data—helping us to better understand the world around us. . Map views, from left to right: value for a specific location (tooltip), explore regional patterns, and compare two maps.
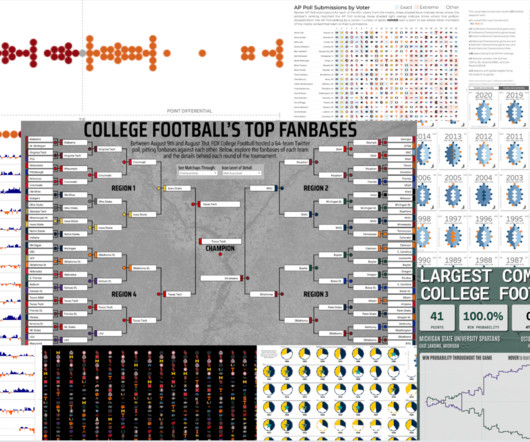
Explore heated rivalries, conference realignment, Heisman Trophy winners, stadium capacity, fan maps, game predictions—the topics are endless! Velleca Measuring Enhanced Analytics Timeline (MEAT) Kyle Umlang College Football Conference History Bo McCready War Damn History Jessica Moon
John Kelly and Ken Deutsch, Morningside Analytics. Social network analysis can help you determine whether you are making an impact in these areas and help you more effectively target your efforts. Using network analysis strategically can you help you stretch your budget -- and enhance your effectiveness. Mapping the Network.
release comes fully-loaded with tons of great features, including several key updates to boost your geospatial analysis. In particular, the new multiple marks layers feature lets you add an unlimited number of layers to the map. Drag and drop map layers—yes, it’s just that easy. The Tableau 2020.4 Getting started is easy!
Laura Quinn at Idealware has been offering Webinars and I will be joining her " Introduction to Website Analytics " on Thursday, September 27th 1:00 - 2:30 EST. You can register here. Through demos of free tools such as AWStats and Google Analytics, we'll look at what these tools can tell you about your site. NEW SEMINAR!
Upgrade now to take advantage of these new innovations, and get the most from your data with our latest augmented analytics features. Now, interacting with and asking questions via Ask Data is a natural part of a user’s analytics workflow. Finding the data you need for your analysis has never been easier. Tableau 2021.2
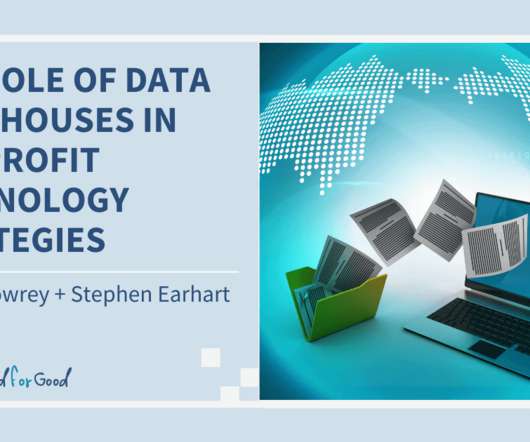
You carefully analyze and map your legacy data, populating your new system until it’s full of your organization’s history. Your CRM is a key tool for engagement and can drive your fundraising strategy, moves management, campaign analytics, and operational reporting.
Across industries, organizations have been investing heavily to integrate analytics throughout every aspect of their company to capture a portion of the $9.5 trillion value that the McKinsey Global Institute estimates advanced analytics can enable. trillion to $15.4
Want Useful Analytics? Tools fall into one of three categories – content analysis, surveys, or analytics. Marlene Oliveira, Copywriter and Communications Consultant, shares an interview with Jason Shim, “ Google Analytics Basics for Nonprofits: Interview with Jason Shim.” Make Sense of Your Data.
Explore heated rivalries, conference realignment, Heisman Trophy winners, stadium capacity, fan maps, game predictions—the topics are endless! Velleca Measuring Enhanced Analytics Timeline (MEAT) Kyle Umlang College Football Conference History Bo McCready War Damn History Jessica Moon
But before you can capitalize on the information stored in your CRM or other nonprofit software, you need to know exactly what analytics to track in the first place. This includes assisting with nonprofit analytics! Definition of Data Analytics for Nonprofits. 4 Types of Data Analytics. Web Analytics.
Senior Director, Solution Engineering, Embedded Analytics. . Monetizing your data or embedding analytics into your core products are great ways to facilitate and provide data and insights when and where your customers need it. Here are a few things to consider if you’re looking to offer a superior experience with embedded analytics.
From this project, I saw a really great post from Darragh Murray about the importance of exploratory data analysis. In the post, Darragh talks about his process on the approach to answering an analytical question. The importance of exploratory data analysis: Exploring the first B2VB challenge. Inspiration. Darragh Murray.
From this project, I saw a really great post from Darragh Murray about the importance of exploratory data analysis. In the post, Darragh talks about his process on the approach to answering an analytical question. The importance of exploratory data analysis: Exploring the first B2VB challenge. Inspiration. Darragh Murray.
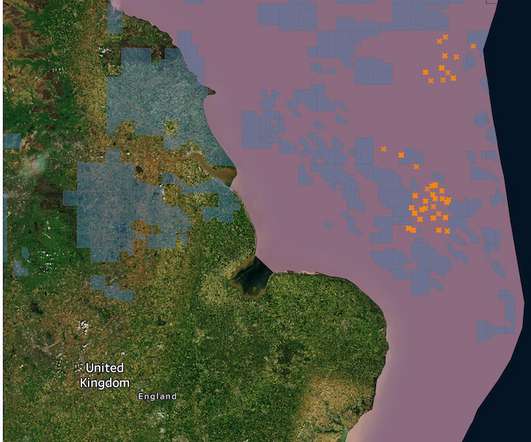
This map is one of a series of 80 global maps describing the state of terrestrial, freshwater, and marine habitats. Their mission is to provide better data and analysis to gauge the success and impact of a social effort and how to improve.
Upgrade to take advantage of these new innovations, and learn more about how Tableau brings AI into analytics to help users across your organization answer pressing questions. Enjoy significant Azure connectivity improvements to better optimize Tableau and Azure together for analytics. Tableau 2021.1 In Tableau 2021.1, Quick LODs.
Immunai’s approach to developing new insights around the human immune system uses a ‘multi-omic’ approach – essentially layering analysis of different types of biological data, including a cell’s genome, microbiome, epigenome (a genome’s chemical instruction set) and more. ’,” said Solomon.
Accelerator Instant access to the best analytic solutions Tableau Accelerators are ready-to-use dashboards that you can combine with your data and customize to fit your needs to help you get to data-driven insights faster. If you want to look at your data geographically, you can plot it on a map in Tableau.
There can be as much value in the blink of an eye as in months of rational analysis.”. ? These actually map out where the user’s mouse goes, so you can see if most users stay on the top fold (i.e. Google Analytics offers a simple version of this; it’s called in-page analytics. Now for the other one – heatmapping tools.
brings practical enhancements to make analytics in your organization more seamless and scalable. Enjoy multiple enhancements to bring your geospatial analysis to the next level, including multiple marks layers support for maps , Redshift spatial support, and more. Product Marketing Specialist, Tableau. Spencer Czapiewski.
Senior Director, Solution Engineering, Embedded Analytics. . Monetizing your data or embedding analytics into your core products are great ways to facilitate and provide data and insights when and where your customers need it. Here are a few things to consider if you’re looking to offer a superior experience with embedded analytics.
Geospatial Analysis in Tableau. Assessing Analytical Maturity. Map Layers, Buffer Calculations & Parameter Actions in Tableau. Show only Selected Countries in a Background Map. Eric Parker , OneNumber. Spencer Baucke. Create Your Own Burger with a Parameter. Rosario Gauna , RosarioViz. Thanksgiving Day NFL Games.
Quick LODs make it easier for analysts to create calculations, bringing some extra speed to their analysis. If you love flexible, cloud database schemas and analyzing maps, then Tableau offered you a lot in 2021. and multiple data source support in map layers with 2021.4. Einstein Discovery in Tableau. Collections.
By Steve Spiker, Director of Research & Technology, Urban Strategies Council As more and more people are bombarded with maps from every media source, many nonprofits find themselves asking “How can we use maps in our work?” – followed by, “Just how hard can it be for us to make maps for our work?”
Thankfully, Google Analytics makes it easy. You’ve likely heard that Google has released its new version, Google Analytics 4 (GA4). What Is Google Analytics 4? But what Google Analytics — and GA4 in particular — brings to the table is an extra layer of information. For Google Analytics, that would be a UTM parameter.
We organize all of the trending information in your field so you don't have to. Join 12,000+ users and stay up to date on the latest articles your peers are reading.
You know about us, now we want to get to know you!
Let's personalize your content
Let's get even more personalized
We recognize your account from another site in our network, please click 'Send Email' below to continue with verifying your account and setting a password.


Let's personalize your content