

Best of the Tableau Web: February 2021
Tableau
MARCH 6, 2021
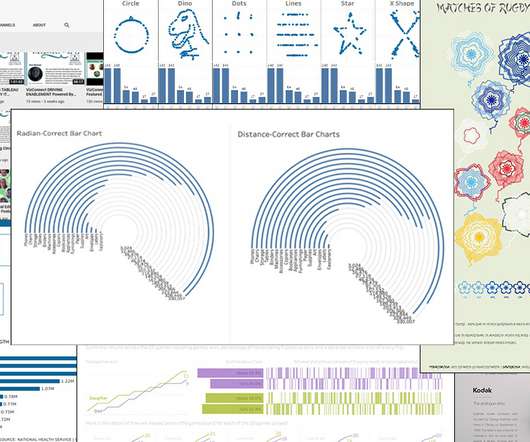
Luke Stanke, Circular Bar Charts: Why you should make them but never share them. Luke Stanke’s post, “ Circular Bar Charts: Why you should make them but never share them ,” explains the challenge. Pierre Hansquine, Bar Charts: The Good, the Bad, and the Ugly. Jeffrey Shaffer, Data + Science : Four Quadrant Charts in Tableau.


Let's personalize your content