This site uses cookies to improve your experience. To help us insure we adhere to various privacy regulations, please select your country/region of residence. If you do not select a country, we will assume you are from the United States. Select your Cookie Settings or view our Privacy Policy and Terms of Use.
Cookie Settings
Cookies and similar technologies are used on this website for proper function of the website, for tracking performance analytics and for marketing purposes. We and some of our third-party providers may use cookie data for various purposes. Please review the cookie settings below and choose your preference.
Used for the proper function of the website
Used for monitoring website traffic and interactions
Cookie Settings
Cookies and similar technologies are used on this website for proper function of the website, for tracking performance analytics and for marketing purposes. We and some of our third-party providers may use cookie data for various purposes. Please review the cookie settings below and choose your preference.
Strictly Necessary: Used for the proper function of the website
Performance/Analytics: Used for monitoring website traffic and interactions
Many organizations measure the success of their products by aggregate revenue, engagement numbers, and member feedback. Understanding post-purchase behavior is an important part of the analysis. Aside from membership, do you know the most valuable products your association offers? What is the trend in sales over time?
When’s the last time you heard a board member say, “Members want…” followed by an aggregate of the last five conversations they’ve had. Dig Below the Surface to Find Gaps in Member Retention It’s likely that your organization measures retention rates, but are you looking at the surface or digging in below the aggregate level ?
Measuring the success of your search engine optimization efforts is important to ascertain whether your time, money and efforts are allocated effectively. Measure the increase of inbound links over a three, six and twelve-month period to understand what content on your website helped draw the most links. Most importantly – revenue.
We’ve been chatting about how to measure the impact of the crowd and she offered to write this guest post on the topic. Measuring Your Crowdsourcing Efforts by Aliza Sherman. In order to know how to measure crowdsourcing results, you first need to understand what kind of crowdsourcing you’re implementing. Measuring Work.
Can your nonprofit even measure its return on investments (ROI)? Constituent relationship management systems (CRM) are a great way to automate data collection, aggregation, and build financial, business, and operational reports–all of which are going to help you the next time you meet with your board. Risk Analysis.
I've been thinking about how you measure what your organization does on Twitter. Given Sean's and Alistair's knowledge in this area, we engaged in a couple of really useful "micro" chats on Twitter about different measurement tools. Aggregate (a Twitter user's followers or friends). What can they measure w/Twitter?
In reflecting over the past three years, the definition of listening tools has broadened beyond “monitoring&# or “research&# to include several categories: social media engagement management, analytics, influencer identification, and social network analysis. Saves a lot of cut and paste time and great for analysis.
This years list of biotech companies reflects the evolving impact of AI, a growing interest in cutting-edge research tools for single-cell analysis and spatial proteomics, and clinical advances for novel drug candidates that promise more convenient and effective treatment for conditions impacting millions of Americans.
Posted by Badih Ghazi, Staff Research Scientist, and Nachiappan Valliappan, Staff Software Engineer, Google Research Recently, differential privacy (DP) has emerged as a mathematically robust notion of user privacy for data aggregation and machine learning (ML), with practical deployments including the 2022 US Census and in industry.
SMART Objectives are specific, measurable, attainable, relevant, and timely objectives. The Aspen Institute’s Nonprofit Advocacy Campaign guide points out they come in three flavors: Tactical: Tools and Techniques. It is also important to think about what specific metrics are needed to measure along the way.
Digital Information World: Analysis summarizing Imperva data on bot traffic and industry breakdowns ( Digital Information World ) We’ve Been Here Before (Sort Of) Remember when mobile overtook desktop? Enhance Security Against Bad Bots Implement CAPTCHAs, rate limiting, and robust security measures.
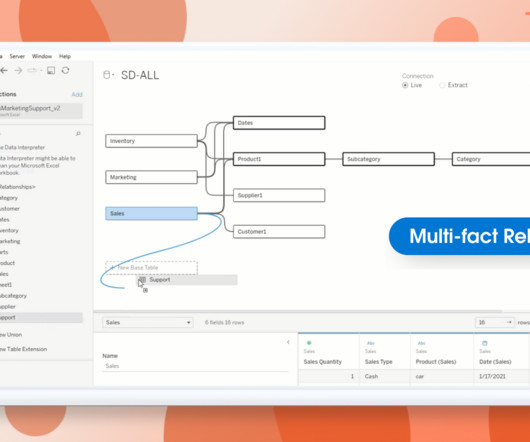
Spencer Czapiewski July 25, 2024 - 5:54pm Thomas Nhan Director, Product Management, Tableau Lari McEdward Technical Writer, Tableau Expand your data modeling and analysis with Multi-fact Relationships, available with Tableau 2024.2. For example, you might have one base table with Sales data and another base table with Marketing data.
In addition to helping make the study, you’ll receive an individualized analysis comparing the data you submitted for your organization to other organizations of your size and type. And we provide analysis that helps put all of that into context and guide decision-making. All-caps bold important.
If we (NPOs) are investing in social media, then we should be measuring it to make sure it drives action – this presentation shows a way for just looking at Twitter using Google Analytics. o Google Analytics is free, as are many other basic analysis tools. o Just gather, analyze, and act based on key performance indicators.
1) Data Analysis and Reporting Marketing automation platforms give aggregated insights into donor behavior and campaign performance. Open rates , click-through rates , conversion rates , and other metrics measure the effectiveness of your fundraising efforts. 2) A/B Testing Not sure what subject line to go with?
To facilitate this decision, DataRobot platform provides Challenger Insights, a deep but intuitive analysis of how well the Challenger performs and how it stacks up against the Champion. DataRobot offers more in-depth analysis in Challenger Insights, including Dual Lift, ROC and Prediction Differences.
In addition to helping make the study, you’ll receive an individualized analysis comparing the data you submitted for your organization to other organizations of your size and type. And we provide analysis that helps put all of that into context and guide decision-making. All-caps bold important.
What is Training Needs Analysis and how to perform it? GyrusAim LMS GyrusAim LMS - Training Needs Analysis is an inevitable part of all the organizations that want to improve their employees’ skill sets and believe in the cumulative growth of the company. This analysis helps them to do their job more effectively.
What is Training Needs Analysis and how to perform it? GyrusAim LMS GyrusAim LMS - Training Needs Analysis is an inevitable part of all the organizations that want to improve their employees’ skill sets and believe in the cumulative growth of the company. This analysis helps them to do their job more effectively.
What is Training Needs Analysis and how to perform it? Gyrus Systems Gyrus Systems - Best Online Learning Management Systems Training Needs Analysis is an inevitable part of all the organizations that want to improve their employees’ skill sets and believe in the cumulative growth of the company.
I'm doing a workshop on Social Media Metrics, Measurement, and ROI at PodCamp Boston tomorrow. But, here are a few comments: Kudos to you for setting clear goals and starting off with measurement from the beginning. You talk about aggregating content, but what about comments/conversation on the blog? | View | Upload your own.
What if you want to aggregate and look at all the comments and responses to threads before responding? Aggregating Conversations. The big deal is that all of this data is in one dashboard, so I can jump straight to analysis, making my weekly report a whole lot easier to produce. Spredfast is one, but are there others?
Measure your outcomes and tell your story. In healthcare organizations, it is vital to be able to show quantitative measurement of your impact, whether you are showing the community benefit impact, tracking dollars spent delivering direct services or reporting back to donors. Augment your reporting with data analysis.
Not that long ago, powerful data management and analysis tools were often only accessible to the commercial sector. Today, there is a wealth of modern tools that make deep and meaningful data analysis more accessible to the nonprofit and social good sector. How can you get data into your platform for future analysis?
A year ago, he said that measuring outcomes for social media is, "an evolving art (not quite a science yet) and you have to be up to the challenge of both thinking a bit differently and be ok with leveraging several different tools. Measuring the success of social media efforts can't be done with a single metric. Technorati ???Authority???
Outline clear metrics to measure success. Reshape and aggregate data as necessary. Rows irrelevant to the analysis (e.g., Data aggregation such as from hourly to daily or from daily to weekly time steps may also be required. dashes and parentheses in telephone numbers) Inconsistent units of measure (e.g.,
Bins Easily group data points to simplify analysis Bins in Tableau group continuous data into discrete intervals, making it easier for you to visualize and analyze data through histograms and other distribution displays. This helps focus the analysis on specific subsets of data, revealing insights and patterns relevant to the chosen criteria.
Users can see top predictors, as well as insights of how to improve their engagement rate, directly in their flow of analysis. Level up your analysis with new analytics enhancements. Simply drag and drop a measure onto a dimension, and Tableau automatically creates a Level of Detail expression with the default aggregation for you.
But, if you want more suggestions, see 22 Must Circle Nonprofit Bloggers and Nonprofits on Google + that Heather Mansfield aggregated. How are you measuring that? Measurement and Learning. It offers a quasi social network analysis to see how your posts are shared: when, by whom, and to whom.
Fitbit activity analysis with DuckDB Photo by Jake Hills on Unsplash Wearable fitness trackers have become an integral part of our lives, collecting and tracking data about our daily activities, sleep patterns, location, heart rate, and much more. I’ve been using a Fitbit device for 6 years to monitor my health.
In an analysis accompanying the new report, they point out data showing that some companies see their enterprise value increase much faster than the competition. Measuring up. Nowhere is this more apparent, the authors claim, than when you look at public B2B SaaS companies. “Investors have forgotten all about the Rule of 40.”
Collaboration: refers to the idea that social media facilitates the aggregation of small individual actions into meaningful collective results. Collective Intelligence: refers to the idea that the social web enables us to not only aggregate individual actions, but also run sophisticated algorithms on them and extract meaning from them.
In a recent analysis , we looked at the characteristics of the December cohort, which totaled $4.2 The $126 million grant, to Easterseals, is an outlier in size and structure—it actually represents an aggregation of grants to a set of individual Easterseals chapters. billion to 384 nonprofits. Grant size distribution.
Web Analytics As Simple Gifts To Measure Mission 3. Web Analytics is the objective tracking, collection, measurement, reporting and analysis of quantitative Internet data to optimize websites and web marketing initiatives. From these questions, you need to pick the three most critical metrics to measure success goals.
Here are four common mistakes my team and I see made by social, government, and nonprofit organizations trying to measure their impact, and tips on how to avoid them: 1. Measuring Too Much. By far the most common problem we see is that most organizations try to measure too much. Little or nothing happened as a result.
Quantitative variables can be measured numerically. Qualitative variables can’t be measured numerically. Data with the same units of measure are best shown using the same scale on a single axis. an “essential question for great data analysis and data visualizations.” Image from How Charts Lie by Alberto Cairo.
Instead of using the %timeit Python function, which runs multiple times and can be heavy on resources for big data tasks, we'll just measure it once. Next up, we’ll run an aggregation query on our Parquet data. Next, we’ll test how ORC handles an aggregation query. So, don’t sweat it if your time is different.
Pave , a San Francisco-based startup that recently graduated from YC Combinator is aiming to end the pay and equity gap with a software tool it developed to make it easier to track, measure, and communicate how and what they pay their employees. Other platforms have tried to do measure pay across roles, such as Glassdoor and Angellist.
I've been retweeting a lot of these links, but I also like to look for patterns and the best way to do that is aggregate them in a single blog post. It has explained social network analysis and techniques in a way that is easy to understand for those who are not experts. How do you measure sucess on Twitter? Take your pick!
There are two solutions for integrating your data — either build an in-house centralized data platform or research an analytics vendor to outsource data collection and analysis. This leads to measurable growth and improved patient results. So, how do healthcare organizations overcome these data silos?
What I learned is that “drive by&# analysis of metrics is really a waste of time. You need to grab the month’s worth of measures and look at them against your content. NutShell Mail is an software that aggregates comments and likes on your fan page and delivers it in one email.
Numeric, quantitative values that you can measure. Measures can be aggregated. When you download your Spotify data, the time measure they use is milliseconds, written as ms. The “Hours played” column and measure will replace any measures related to milliseconds or “msPlayed” in the instructions.
Back in 2007, when Facebook opened it doors to people older than college students and nonprofits started the early experiments on Facebook Causes, Froggy Loop did an extensive analysis " The Long, Long Tail of Facebook Causes " using the dollars per donor analysis. The nonprofit doesn't have to do all the heavy lifting.
The sector deserves comprehensive and computable data that can be openly aggregated, searched, checked, and analyzed. They’ve had to do this conversion because there has been no comprehensive set of open data about the nonprofit sector available to them or the many others who would take advantage of it.
We organize all of the trending information in your field so you don't have to. Join 12,000+ users and stay up to date on the latest articles your peers are reading.
You know about us, now we want to get to know you!
Let's personalize your content
Let's get even more personalized
We recognize your account from another site in our network, please click 'Send Email' below to continue with verifying your account and setting a password.


Let's personalize your content