This site uses cookies to improve your experience. To help us insure we adhere to various privacy regulations, please select your country/region of residence. If you do not select a country, we will assume you are from the United States. Select your Cookie Settings or view our Privacy Policy and Terms of Use.
Cookie Settings
Cookies and similar technologies are used on this website for proper function of the website, for tracking performance analytics and for marketing purposes. We and some of our third-party providers may use cookie data for various purposes. Please review the cookie settings below and choose your preference.
Used for the proper function of the website
Used for monitoring website traffic and interactions
Cookie Settings
Cookies and similar technologies are used on this website for proper function of the website, for tracking performance analytics and for marketing purposes. We and some of our third-party providers may use cookie data for various purposes. Please review the cookie settings below and choose your preference.
Strictly Necessary: Used for the proper function of the website
Performance/Analytics: Used for monitoring website traffic and interactions
Many organizations measure the success of their products by aggregate revenue, engagement numbers, and member feedback. Understanding post-purchase behavior is an important part of the analysis. Aside from membership, do you know the most valuable products your association offers? What is the trend in sales over time?
Check our blog – you will find that we periodically report on the aggregated polling results. In question 1, the response rate for people finding it easier to conduct fundraising campaigns was higher than our observed norm, 29% today vs. 21% all results aggregated. From this group of respondents, we learned a few things.
Posted by Badih Ghazi, Staff Research Scientist, and Nachiappan Valliappan, Staff Software Engineer, Google Research Recently, differential privacy (DP) has emerged as a mathematically robust notion of user privacy for data aggregation and machine learning (ML), with practical deployments including the 2022 US Census and in industry.
This partnership meets a community need to apply an intersectional lens to data analysis and enables funders and nonprofits to gain insight into disparities masked by aggregated data. It also provides a quantitative baseline to evaluate and build upon equity strategies.
What is Training Needs Analysis and how to perform it? GyrusAim LMS GyrusAim LMS - Training Needs Analysis is an inevitable part of all the organizations that want to improve their employees’ skill sets and believe in the cumulative growth of the company. This analysis helps them to do their job more effectively.
What is Training Needs Analysis and how to perform it? GyrusAim LMS GyrusAim LMS - Training Needs Analysis is an inevitable part of all the organizations that want to improve their employees’ skill sets and believe in the cumulative growth of the company. This analysis helps them to do their job more effectively.
What is Training Needs Analysis and how to perform it? Gyrus Systems Gyrus Systems - Best Online Learning Management Systems Training Needs Analysis is an inevitable part of all the organizations that want to improve their employees’ skill sets and believe in the cumulative growth of the company.
The data set is a goldmine for researchers and evaluators interested in better understanding the demographics of the nonprofit sector. It also offers suggestions on when researchers and evaluators may want to choose one method to access the data over the other. And perhaps even more exciting, it’s also free to access.
1) Data Analysis and Reporting Marketing automation platforms give aggregated insights into donor behavior and campaign performance. Use benchmark data from past actions or other nonprofits to evaluate your campaigns, and then work to improve the metrics that matter most. 2) A/B Testing Not sure what subject line to go with?
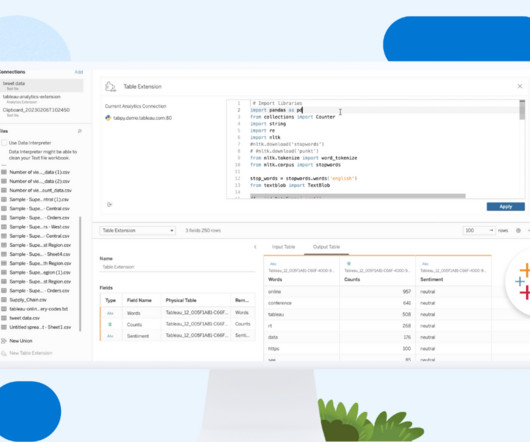
Use Analytics Extensions in Table Calculations Table calculations trigger upon interaction and allow for dynamic what-if analysis. Then in the function, we define the deployed model we’re invoking, the model’s inputs, and the values passed from Tableau to the model which can be either aggregated or disaggregated.
Twitter Karma is a great tool to use if you want to inventory your Twitter community, clean up any nonreciprocal followers, or simply evaluate your lists. Social Actions is an aggregator of 50+ social action-related sources across the web. Tags: strategy analysisevaluation social media. Give it a try! Groups & Pages.
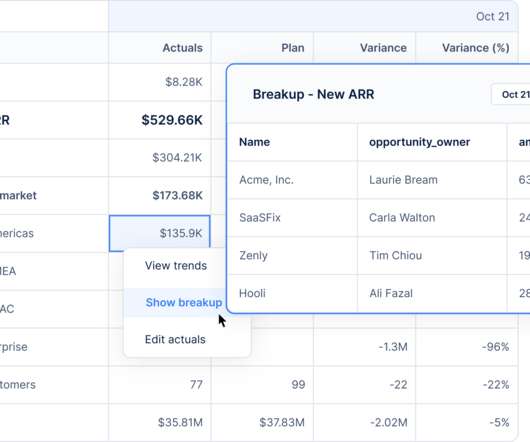
During his six years at the firm, Goel evaluated hundreds of SaaS companies and served on many of their boards. Drivetrain’s software showing revenue and customer buildup report with line items for analysis and insights. One question that fascinated me was ‘what makes the execution of a company predictable’? Image Credits: Drivetrain.
Use Analytics Extensions in Table Calculations Table calculations trigger upon interaction and allow for dynamic what-if analysis. Then in the function, we define the deployed model we’re invoking, the model’s inputs, and the values passed from Tableau to the model which can be either aggregated or disaggregated.
In an analysis accompanying the new report, they point out data showing that some companies see their enterprise value increase much faster than the competition. And which benchmarks can they use to evaluate their performance? Nowhere is this more apparent, the authors claim, than when you look at public B2B SaaS companies.
These are drawn from some work we did in an evaluation ( see the report ) of the ReliefWeb web site of the UN's Office for the Coordination of Humanitarian Affairs. While aggregated information can help build trusted customers, it does not move the host organization to becoming influential. (Don't we all !).
Fitbit activity analysis with DuckDB Photo by Jake Hills on Unsplash Wearable fitness trackers have become an integral part of our lives, collecting and tracking data about our daily activities, sleep patterns, location, heart rate, and much more. I’ve been using a Fitbit device for 6 years to monitor my health.
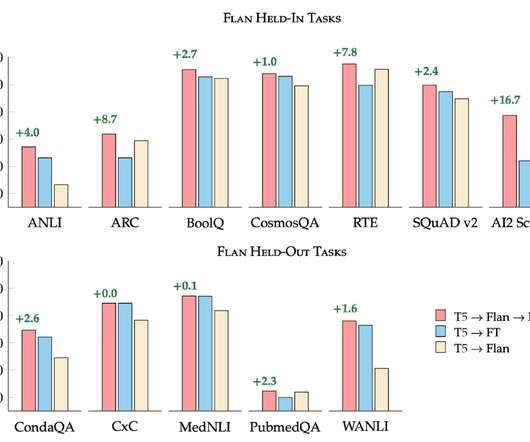
We show that training a model on this collection yields improved performance over comparable public collections on all tested evaluation benchmarks, e.g., a 3%+ improvement on the 57 tasks in the Massive Multitask Language Understanding (MMLU) evaluation suite and 8% improvement on BigBench Hard (BBH).
Evaluate the computing resources and development environment that the data science team will need. Reshape and aggregate data as necessary. Rows irrelevant to the analysis (e.g., Data aggregation such as from hourly to daily or from daily to weekly time steps may also be required. Identify project stakeholders.
Online versions of assessments for participants that would can calculate individual scores and show aggregate results. I do have a file with the questions, so I can do an analysis of the questions and think about how to improve my materials. Flash polls. I tested a few different options and here’s what I learned so far.
Collaboration: refers to the idea that social media facilitates the aggregation of small individual actions into meaningful collective results. Collective Intelligence: refers to the idea that the social web enables us to not only aggregate individual actions, but also run sophisticated algorithms on them and extract meaning from them.
Alberto Cairo, data visualization expert and author of How Charts Lie Whether you are reading a social post, news article or business report, it’s important to know and evaluate the source of the data and charts that you view. When viewing summary numbers, evaluate if the summary number is appropriate.
Each type dictates a different process and therefore requires different measurement and analysis methods. Does the input aggregated allow you to move forward on a project or move forward in a new direction? There are three main types of crowdsourcing: Work, Input and Action. Measuring Work. Does it help you solve a problem?
I'd like to see an analysis of retweeting, number of new donors, an overlay of the blogging campaign with the hash tag trending, how much off twitter promotions generated direct traffic to donations page and vice a versa. TwitLinks aggregates the latest links from the worlds top tech twitter users.
By exporting data, users can maintain access to historical comparisons and enable future analysis. Data connectors can consolidate data from many different platforms, not just UA and GA4, significantly streamlining the data aggregation process and providing a more comprehensive view of your organization’s data.
You have to ask, how is polling the audience and seeing the aggregate results helping people learn? Here how collecting data and displaying aggregate might enhance learning: (Add in the comments if you think I missed anything). Participants took the assessment and we saw the aggregate results. In other words, to what end?
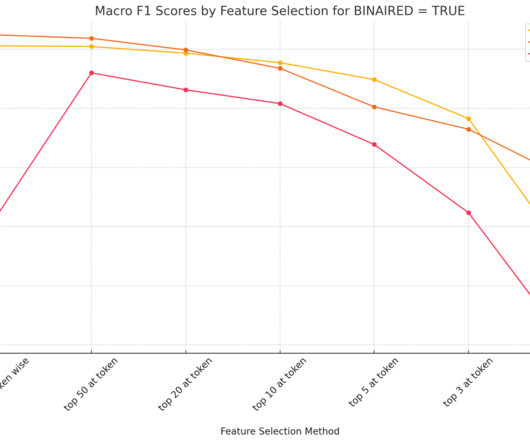
TL;DR: Recent work has evaluated the generalizability of Sparse Autoencoder (SAE) features; this study examines their effectiveness in multimodal settings. We evaluate feature extraction using a CIFAR-100-inspired explainable classification task, analyzing the impact of pooling strategies, binarization, and layer selection on performance.
You may also want to improve your organization's reputation as an expert by being consistently involved in discussions on topics or aggregating information that are relevant to your organization. Jeremiah Owyang, Social Network Sites Use Analysis - Compilation of Research Facts. Josh Bernhoff, Social Technographics 2008 3.
Analysis & Strategy: The consultant conducts an analysis of your current software and formulates a strategy to align those solutions with your goals. Research top providers online using third-party sites, review aggregators, and educational guides. Develop methods for evaluating the success of each benchmark goal.
Couldn't someone build a NPO aggregator "clearing house" that did all of the dirty work Apple doesn't want to get involved in? The aggregator itself could be an app for the Apple platform. In such a scenario, Apple would only have to approve the aggregator app, not the individual NPOs themselves.
Like other services automating offsetting, Patch evaluates projects based on their additionality (how much additional carbon they’re removing over an already established baseline), permanence (how long the carbon emissions will be sequestered) and verifiability. .”
how do you evaluate the health significance of "one glass of rice wine per day" in China vs. Japan?). and develop an end-to-end system that manages those key points all the way from collection through regional, national, and international aggregation to analysis.
Across the board within the 2021 study, which evaluated employee attitudes during 2020, the data revealed high-water marks in employee satisfaction. This year, the aggregated figure stood at 92% of positive responses. There is a curiosity when looking at historical data — a period covering the calendar years 2019-2023.
It is often used to reduce continuous data into more manageable discrete categories, preserve data privacy through aggregation, generate histograms, or create breaks for ordinal color scales. Future work should look at further evaluating OSCAR’s semantic bin quality during users’ analytical workflows in these tools.
It is often used to reduce continuous data into more manageable discrete categories, preserve data privacy through aggregation, generate histograms, or create breaks for ordinal color scales. Future work should look at further evaluating OSCAR’s semantic bin quality during users’ analytical workflows in these tools.
DataRobot provides warnings so that you can evaluate whether the data source needs investigation and maintain more accurate models. With it, users can automatically prepare relational data, running complex joins and aggregations to extract predictive features. Automated feature discovery.
In reading through this amazing outpouring of posts, people have been very transparent if they are nominating their own project as well as their criteria and evaluation thought process. Holden not only shared his recommendations, but gave us a detailed description of his evaluation process. The NTEN's NTC and NPTech Pipe.
Many programs, when evaluated, have been shown to be ineffective or have negative outcomes. There are some key elements to look for when your organization is ready to evaluate a performance management data system. Evaluate how easy the technology is to learn and how intuitive it is to navigate. Evaluate the system's security.
The evaluation of each phase typically relies on comparing a dirty dataset against a clean (ground truth) version, using classification metrics like recall, precision, and F1-score for error detection (see for example Can Foundation Models Wrangle Your Data?
It looked a little more comprehensive then just asking people to tag and then trying to aggregate (we also looked at other tools like CrowdVine which was very comparable, almost a coin flip). The other thing we cut out was the old paper based session evaluations. It’s simple to do cause it is just a link to a web site.
It allows us to easily combine data from other sources and summarize it at the unit of analysis of our project. Also, it will automatically compute moving aggregations, such as the average price by neighborhood for the last week, month, and three months. After training a model, it is important to assess its fairness.
Our monitoring includes: Tweetdeck for iPhone Dual office monitors -- one for work, one for Tweetdeck "As it happens" Google Alerts for name, acronym, CEO's name An iGoogle dashboard aggregating web alerts Make your commenting policy known and fair. Post your commenting policy on your Fan Page's info tab. Have a response process.
These tools aggregate and organize information about your supporters, past campaigns, and the broader market. At Allegiance Group + Pursuant, we combine our years of nonprofit marketing experience with thorough data analysis. Like a market analysis, examining each of these factors gives you more information about the world around you.
The key is to think critically and take time to evaluate the interpretations of data portrayed in charts. Is the interpretation appropriate for the data analysis shown? Sometimes an appropriate chart and analysis can be misinterpreted. Consider the possibility of bias in the analysis and presentation of the data.
To reference earlier points in the hype curve, xAPI is what the ACCME should be using to analyze the aggregate educational value of CME activities. Cutting back on the administrative headache of tracking credits for certificants is an imperative for the eLearning industry.
We organize all of the trending information in your field so you don't have to. Join 12,000+ users and stay up to date on the latest articles your peers are reading.
You know about us, now we want to get to know you!
Let's personalize your content
Let's get even more personalized
We recognize your account from another site in our network, please click 'Send Email' below to continue with verifying your account and setting a password.


Let's personalize your content