Remove Aggregator Remove Analysis Remove Chart
article thumbnail

How to Spot Misleading Charts, a Checklist

Tableau

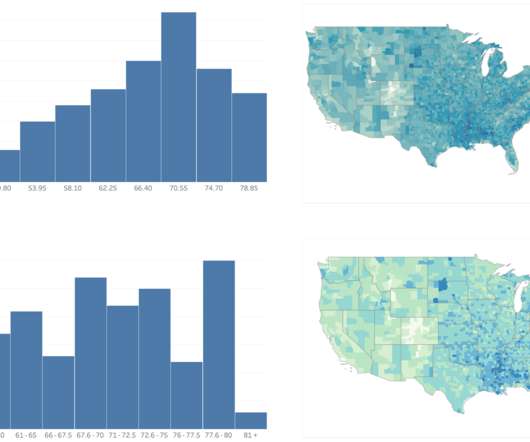
Alyssa Jenson November 14, 2023 - 6:59pm Sue Kraemer Senior Data Skills Curriculum Strategy Manager, Tableau Charts are all around us. When viewing and creating charts, it’s vital that we gain the ability to critically explore and discern the integrity of the information and conclusions shown in charts. Chart Design.

Chart 121
article thumbnail

25 SMART Social Media Objectives

Beth's Blog: How Nonprofits Can Use Social Media

Spitfire’s useful SMART chart planning tool has been used by many nonprofits and was adapted for social media for nonprofits by NTEN’s WeAreMedia project several years ago. Finally, allocating time for a reflection about what worked, what didn’t based on an analysis of the data is critical.

professionals

Sign Up for our Newsletter

This site is protected by reCAPTCHA and the Google Privacy Policy and Terms of Service apply.

article thumbnail

How To Spot Misleading Charts: Review the Message

Tableau

Ateken Abla November 14, 2023 - 6:59pm Sue Kraemer Senior Data Skills Curriculum Strategy Manager, Tableau Charts exist everywhere. Viewing a chart instead of a table of numbers helps us quickly understand data, see patterns, and make better decisions. In the same way that words can deceive, so can charts. Be aware of the SCAM!

Chart 52
article thumbnail

VizQL Data Service from Tableau: Use Your Data, Your Way

Tableau

You could also use filtering, sorting and ad-hoc aggregations and calculations to power a custom UI for your application with data you already trust from Tableau. It is essentially a translator of SQL queries that traditionally return numbers and tables into an effortless visual analysis.”

Data 141
article thumbnail

How To Spot Misleading Charts: Know the Source

Tableau

Ateken Abla November 14, 2023 - 6:59pm Sue Kraemer Senior Data Skills Curriculum Strategy Manager, Tableau Charts are all around us. When viewing and creating charts, it’s vital that we gain the ability to critically explore and discern the integrity of the information and conclusions shown in charts. Don’t be SCAM’d!

Chart 52
article thumbnail

Making meaning of Candid’s free demographic data set 

Candid

For example, the charts below (also included in the manual) illustrate how complete the data is across different staffing levels and demographic questions. As of October 2023 when this analysis was conducted, the total number of all responding organizations was 59,749.

article thumbnail

SaaS in 2021: How prodigious growth changed the startup landscape permanently

TechCrunch

In an analysis accompanying the new report, they point out data showing that some companies see their enterprise value increase much faster than the competition. Just look at this chart: Nowhere is this more apparent, the authors claim, than when you look at public B2B SaaS companies. ” OpenView Partners. Measuring up.

Change 85